Whether you’re looking for reliable sources of passive income or new capital to re-invest, dividend investing can be a vital strategy that helps you meet your financial goals.
Executed well a dividend investing strategy can be suitable for DIY Investors with less appetite for risk.
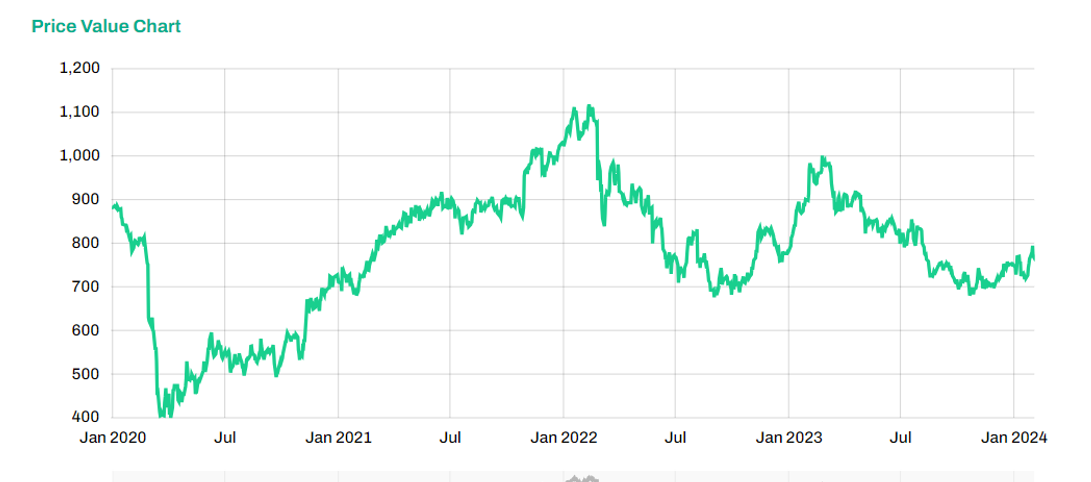
PETERSHILL PARTNERS (LSE:PHPL) (174.2)
Petershill Partners PLC operates as a general partner solutions investment firm. It provides capital and strategic support to asset managers through minority stake acquisitions. The company was formerly known as Delta Epsilon plc and changed its name to Petershill Partners PLC in September 2, 2021. The company was founded in 2007 and is based in London, the United Kingdom. Petershill Partners PLC operates as a subsidiary of Goldman Sachs Asset Management, L.P.
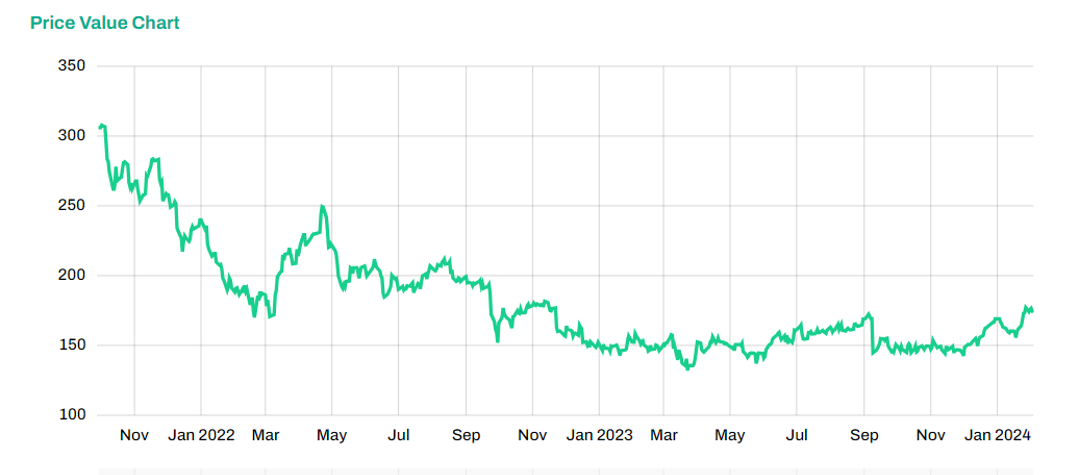
The 12-month indicated dividend yield is 7.2%. This estimated dividend represents 60.4% of the estimated earnings. Consequently, the dividend is covered, but notstrongly, and reasonably likely to prove sustainable.
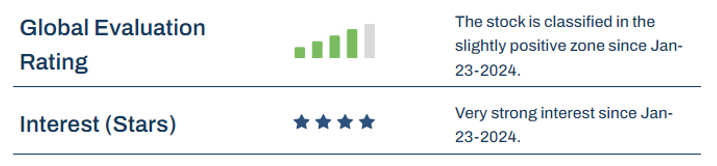
The stock meets all our stars. The market, analysts and fundamental analysis have shown positive signals. PETERSHILL PARTNERS was considered attractive by the market and also moved positively against the STOXX600 index.
The stock remains fundamentally cheap and analysts were optimistic in revising earnings forecasts upwards.The situation in the sector environment is also pleasing and, with one star less, is only slightly worse. In the past, the share price has reacted to stressful situations with typical market price losses. Loss sensitivity is an important valuation criterion for us, just like the star rating. Taking into account this average loss sensitivity, we obtain an overall positive impression.
PETERSHILL PARTNERS appears fundamentally undervalued compared to its theoretical fair price. Its valuation is less attractive than the European Financial Services aggregate. The fundamental price potential for PETERSHILL PARTNERS looks good. The forecasted PE of 8.4 is 26.6% below the industry average of 11.4. Note that the projected earnings growth to the estimated PE ratio of 3.16 is very high, indicating a potentially out of the norm situation, like an extraordinary decline earnings followed by rebound expectations.
PETERSHILL PARTNERS is moderately followed by financial analysts, as over the last three months an average of 8 analysts provided earnings estimate forecasts up until the year 2025. Exceptionally high earnings growth (19.4%) is expected over the next few years. Currently, these analysts are positively revising their earnings growth estimates by 2.1% compared with seven weeks ago. This positive pressure confirms the positive technical trend.
SECURE TRUST BANK (LSE:STB) (706)
Secure Trust Bank PLC provides banking and financial products and services in the United Kingdom. It operates through four segments: Real Estate Finance, Commercial Finance, Vehicle Finance, and Retail Finance. The Real Estate Finance segment provides secured loans against property assets. The Commercial Finance segment provides invoice discounting solutions, coronavirus business interruption loan scheme, and recovery loan schemes. The Vehicle Finance segment provides hire purchase lending for used cars. The Retail Finance segment offers unsecured finance for consumer products, including bicycles, music, furniture, outdoor/leisure, electronics, dental, jewelry, home improvements, and football season tickets. It also engages in the leasing of property business. Secure Trust Bank PLC was founded in 1952 and is headquartered in Solihull, the United Kingdom.
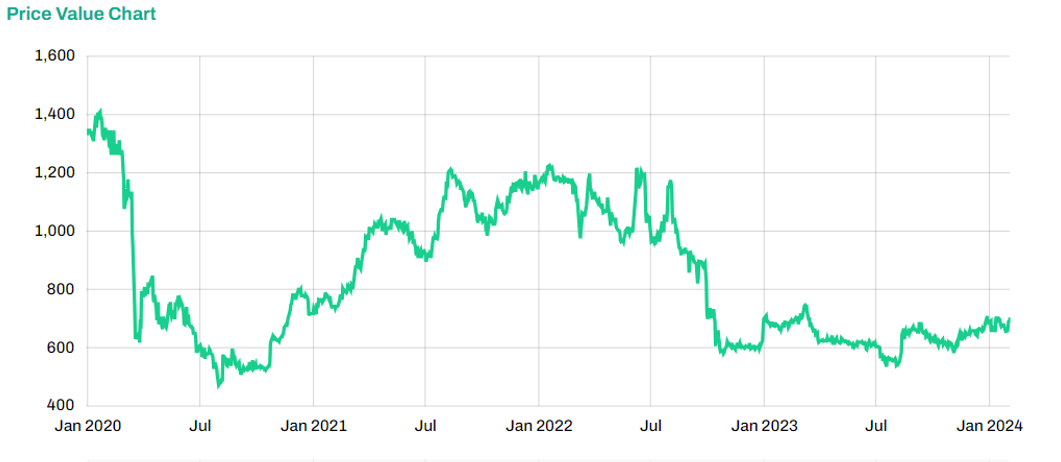
The 12-month indicated dividend yield is 7.7%. This estimated dividend represents 20.2% of the estimated earnings. Consequently, the dividend is easily covered, and very likely to prove sustainable.
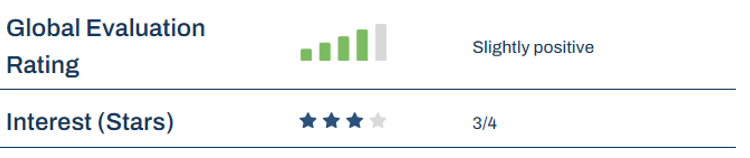
The stock currently meets three of our four stars. From a fundamental point of view, the share price is attractive and the future prospects are intact according to analysts. The forecasted PE of 2.6 is very low, and 57.4% below the industry average of 6.2.Market signals in this case are mixed: the share price has recently been trending upwards, but has not always been able to follow the STOXX600 index over the past four weeks.
With two stars currently, the sectoral environment seems somewhat less favourable. In the past, the share price has reacted to stress signals with below-average price losses. We view this defensive behaviour as positive. This is an important valuation criterion, equivalent to the star rating. Taking into account this defensivesensitivity to losses, we obtain an overall positive impression.
SECURE TRUST BANK is weakly followed by financial analysts, as over the last three months an average of 4 analysts provided earnings estimate forecasts up until the year 2025. Exceptionally high earnings growth (13.1%) is expected over the next few years.Currently, these analysts are positively revising their earnings growth estimates by5.9% compared with seven weeks ago. This positive pressure confirms the positive technical trend.
WPP (LSE:WPP) (775.4)
WPP plc, a creative transformation company, provides communications, experience, commerce, and technology services in North America, the United Kingdom, Western Continental Europe, the Asia Pacific, Latin America, Africa, the Middle East, and Central and Eastern Europe. The company operates through three segments: Global Integrated Agencies, Public Relations, and Specialist Agencies. It offers advertising, marketing, brand strategies, and campaigns across all media; and provides media planning and buying services. It also provides media investment; data and technology, and content services. The company also offers public relations and specialist agency services. WPP plc was founded in 1985 and is based in London, the United Kingdom.The stock meets all our stars. The market, analysts and fundamental analysis.

The 12-month indicated dividend yield is 5.1%. This estimated dividend represents 39.6% of the estimated earnings. Consequently, the dividend is easily covered, and very likely to prove sustainable.
The stock meets all our stars. The market, analysts and fundamental analysis have shown positive signals. WPP was considered attractive by the market and also moved positively against the STOXX600 index. The stock remains fundamentally cheap and analysts were optimistic in revising earnings forecasts upwards. The situation in the sector environment is also pleasing and, with one star less, is only slightly worse. In the past, the share price has reacted to stressful situations with typical market price losses. Loss sensitivity is an important valuation criterion for us, just like the star rating. Taking into account this average loss sensitivity, we obtain an overall positive impression.
WPP appears fundamentally very undervalued compared to its theoretical fair price. Its valuation is comparable to the European Media aggregate. The fundamental price potential for WPP looks good, and in line with the average of
its industry group.
WPP is strongly followed by financial analysts, as over the last three months an average of 15 analysts provided earnings estimate forecasts up until the year 2025. The expected earnings growth of 6.2% is below the industry average of 16.6%.
Currently, these analysts are positively revising their earnings growth estimates by 1.5% compared with seven weeks ago. This positive pressure on the growth expectations has been apparent since February 2, 2024. confirms the positive technical
trend.
Disclaimer
The system provides information and financial data to help you identify investment ideas. However, we do not advise or guide you in this regard, or provide recommendations on what products to buy or sell – these decisions are yours alone. SDIS and the system are not subject to regulation, and SDIS does not hold a license for investment advice, investment marketing or management of investment portfolios under any law.
The content provided in the system is independent and is not based on or tailored to your personal circumstances, needs or purposes, and should not be relied upon as an assessment of the profitability or suitability of investing in a particular stock for any purpose. Past performance is no guarantee of present or future performance. Investments can lose their full value.