Establishing a robust foundation
For some people, the process of making investment decisions isn’t a whole lot more sophisticated than sticking a finger in the air to see which way the wind is blowing. Even when they conduct more rigorous research, they find that the data and analysis on offer is often functionally opaque, too complex, badly reasoned, or even contradictory. Even the most well-intentioned financial advisors, bloggers and tipsters will often be careful not to reveal the complete logic behind their thinking for fear of disclosing their ‘secret sauce’ or inadvertently revealing the fact that the emperor has no clothes! As a result, wading through masses of opinion to reach your own conclusions can be a daunting, frustrating and often fruitless task, leaving you with questions unanswered and a sense that there must be a better way to go about this.
Here at Aurora our mission is to empower investors, enabling them to identify value investments for the medium- to long-term, and we take our approach to DIY investing very seriously. Not only do we think that responsible individual investors deserve access to the same high-quality research and data being used by institutional investors, but we also think they should be able to take advantage of the same quality of analysis. But in this context, what is ‘quality’?
More science, less art
- We remove the guesswork.
Instead of relying on an individual advisor or analyst’s experience and knowledge of how markets or stocks will perform in evolving market conditions, we take a QUANTITATIVE approach, combining multiple factors into a single transparent model that allows us to conduct a SYSTEMATIC analysis of markets, Industries, stocks and funds. This means that you can feel confident that we are using the same approach for each possible investment, reducing uncertainty about the data, removing the possibility of bias and ensuring a level of objectivity which you’ll be hard-pressed to find elsewhere. Furthermore, because our analysis tomorrow is based on the same approach as our analysis today (and yesterday!) you will get a truer picture of how a potential investment is performing over time. - We open up the Black Box.
Because we know you prefer transparency to obfuscation, and clarity to ambiguity, our methodology and the data we use to perform our analysis is completely open for you to research and examine or draw your own conclusions from. The level of detail might surprise you, and the language we use might be quite daunting, but you’ll find a complete overview below and we’re completely open to questions if you have any. Our objective is to help you feel more confident in your investment decision-making approach, so we want you to be able to follow our analysis step-by-step without having to rely on invisible assumptions or algorithmic trickery. - We don’t take shortcuts with our data.
In order to maintain the consistency of our method we only include firms and funds that provide exactly the information we need to conduct our systematic analysis. In practice this means that you won’t find every possible investment here because not every company is willing or able to provide the data we need so we do not include every company we’re aware of. That being said, because we take data integrity so seriously, our basis for incorporating companies or funds into our system is as systematic as the analytical model itself, and this ensures that we minimise uncertainty by avoiding unknown factors and risks. - We make complexity, simple.
Even the basics of financial analysis can be mystifying to the uninitiated, so we like to make things simple by taking complex financial data and transforming it into intuitive, easy-to-understand evaluation metrics that take the pain out of your decision-making process without sacrificing the underlying sophistication of the methodology. - Our systematic approach lets you define your own rules.
Because we structure our analysis so systematically, we are able to separate out the various factors that inform our model and provide the means for you to set up rules which you can apply as filters to identify the investments which more closely fit with your personal investment style and goals. - We don’t make recommendations, we let the numbers speak for themselves.
One advantage of our systematic approach is that we significantly reduce the requirement for interpretation. By demonstrating that we are applying the same analytical model to each of the potential investments we examine, what we are really saying is that even if you disagree with the formulation of the model itself, the numbers themselves still provide a useful metric for systematic comparison. We let you choose the factors that are important to you so that you can draw your own conclusions based on your preferences, goals, or investment style.
The Elements of Aurora Analysis
- A multi-dimensional model that incorporates fundamentals with both technical and risk components. Key factors include: Price potential, Earning Trends, Relative Performance and Market Trends (Medium Term Technical Trends).
- We use a variety of data sources including aggregated analyst estimations, market data, performance analytics and risk assessments.
- Our system reveals the correlations and relationships between individual assets and investment vehicles to provide meaningful analysis and actionable insights.
- When assessing an investment, we know you have your own risk tolerances, so we provide risk analysis for each investment opportunity as well as your overall portfolio.
- Our analysis is updated twice a week based on the closing prices on the day, thereby ensuring that you get regular updates on performance and expectations, and also get to make your decisions in a timely way.
The Metrics that Matter
Here we outline the various high-level metrics which are incorporated into Aurora’s Systematic analysis, along with a breakdown of the various data points and the metrics which inform them.
Global Evaluation Metric
Designed to give a broad overview of an investment at a particular point in time, Aurora’s Global Evaluation Metric combines multiple factors which we outline in more detail below. These include fundamental and technical elements such as Valuation, Earnings Revisions Trend, Technical Trends and Group Benchmarking, along with sensitivity (Risk) ratings based on the “Bear Markets” and “Bad News” Factor Metrics. These factors are then visualised as a simple volume bar where ![]() indicates the best possible rating and
indicates the best possible rating and ![]() indicates the worst.
indicates the worst.
Star Rating Metric
This metric incorporates several factors (each of which is outlined in more detail below) and includes:
- Earning Revision Trend
- Valuation Rating
- Medium Term Technical Trend and (Market Trend)
- 4-week Relative Performance > 1%
We assess performance against each of these metrics and award a 0 to ![]()
![]()
![]()
![]() rating.
rating.
Earning Revision Trend (Earnings Rev Trend)
This is an abbreviation for 7 week Earnings Per Share Revision. This column concerns the value of these revised earnings. A figure of 2.8 implies that the analysts, compared with seven weeks ago, have now revised and raised their estimates by 2.8%. On the contrary, a negative number means that the earnings were revised at a lower estimate.
If the earnings revision is between -1% and 1% the analysts estimates are neutral.
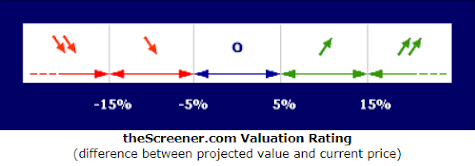
Price Valuation Rating
We use Peter Lynch’s valuation methodology to assess whether a stock is trading at fair value, premium (over-valued) or discount (under-valued). This method compares expected earnings increase + dividend yield with estimated multiplier ratio.
Based on this approach a ratio below 0.9 indicates that investors must pay a premium for the growth potential since the stock is more highly valued and if the ratio is above 0.9, the stock is undervalued.
“Since Lynch was always looking for strong growth companies he could not use the traditional Price Earnings ratios as means for valuation because the markets would often bid those stocks up on expectations. So he created a metric called PEG which stood for Price Earnings Growth. The idea was that if a company was growing at 15% per annum then 15 P/E was a reasonable price to pay for the stock. It’s a simple shortcut that ignores many macro fundamentals but that was precisely the point. It was used as a rough measure to make sure that the investor did not grossly overpay for a stock ( for example buying a stock at 50 P/E for a company that was growing at only a 10% rate).” – Boris Schlossberg, BK Asset Management
Information Ratio (for fund analysis)
The information ratio (IR) measures portfolio returns against the returns of a benchmark, usually an index, related to the volatility of those returns. The benchmark used is often an index that represents the market or a particular sector or industry. IR is often used as a measure of a portfolio manager’s level of skill and their ability to generate excess returns relative to a benchmark, but it also attempts to identify the consistency of the performance by incorporating a tracking error, or standard deviation component into the calculation.
.
Further Information
SharpE Ratio (for fund analysis)
Developed by Nobel laureate William F. Sharpe, the Sharpe Ratio is one of the most well-known investment metrics and and is used to help investors understand the return of an investment compared to its risk.
You can read more about how the Sharpe Ration is calculated here, but for our purposes the most important thing to know is that the higher the ratio, the better and that generally speaking, anything below one should be considered suboptimal and too risky.
Medium Term Technical Trend (MT Tech Trend)
MT Tech Trend is a technical indicator which we use to provide an assessment of whether the market like an investment or dislike it. If it is positive it indicates that the market currently “likes” (or, is buying) the stock. If it is negative it indicates that the market currently “does not like” (or, is selling) the stock.
4-Week Relative Performance (4wk Rel Perf)
This figure measures the performance of a STOCK relative to its national or regional index in the last 4 weeks).
6-MONTH RELATIVE Performance (6M Rel Perf)
This figure measures the performance of a FUND relative to its benchmark in the last six month.
Long Term Growth Forecast (LT Growth)
This is the estimated annual growth rate of future earnings. It is normally projected over the next two to three years, and is expressed as a percentage.
Growth / Price-Earnings Ratio (G/PE Ratio)
The G/PE Ratio is the basis of our Valuation Rating (above) and is expressed as the estimated growth of future earnings (LT Growth) plus dividend in %, divided by the estimated future PE ratio (Long Term P/E).
Bad News Factor
To determine the Bad News Factor, we analyse a stock’s declines in rising markets. In this purely objective analysis, the actual reasons for a stock’s behaviour are not important since if a stock price falls while its relative index goes up, it can be assumed that the stock’s performance has been affected by bad news – hence the name, Bad News Factor.
The Bad News Factor shows the average deviation per bad news event between the stock and its reference index over the previous 52 weeks and is expressed in basis points. In general terms, the higher the Bad News Factor, the more a stock has been sensitive to bad news.
Bear Market Factor
To determine the Bear Market Factor we analyse the relationship between a stock’s price movements and declining markets, hence the name, Bear Market Factor.
The Bear Market Factor expresses in basis points the average difference over 52 weeks between the moves of the stock price and the moves of the reference index only during declines of the reference index.
The higher the Bear Market Factor, the more a stock has dropped when its relative index dropped. A Bear Market Factor that is strongly negative means the stock has been more resistant to losses in declining markets.
Sensitivity (Risk)
Stock price movements are generally volatile and contain sensitivity that can result in a total loss. Based on their historical behaviour, we classify stocks by sensitivity level which are assessed solely relative to other stocks.
It should be noted that even Low Sensitivity stocks remain highly sensitive investments that can lose up to all of their value, and that past performance is no indication of current or future performance.
We determine Sensitivity by measuring the “Bear Market” Factor and the “Bad News” Factor against the benchmark and identify three levels:
Low Sensitivity: In this case, the sensitivity indicators fall below the world reference average.
Moderate Sensitivity: In this case, the sensitivity indicators are higher than the world reference average, but lower than the standard deviation.
High Sensitivity: At which the sensitivity indicators are at levels higher than the standard deviation.