Finding undervalued stocks is one of the best ways to outperform the market over the long term. It’s an approach involving buying stock in solid companies that are lower priced relative to their earnings and long-term growth. When the market eventually discovers the company’s undervalued, the returns can exceed the market.
Undervalued Stocks In The US– Analysis for 13.1.2023
The challenge for every investor is to find these undervalued stocks.
One way for the investor is to analyze data by himself and make a conclusion if the stock is undervalued. This requires knowledge, its time-consuming and the coverage for very limited.
Another way is to learn about an undervalued company from a published source. The problem with this is that once that information becomes public, and there’s a recommendation behind it, the price may rise in a hurry and the stock will no longer be undervalued. In addition, you do not know what is behind the analysis and recommendation.
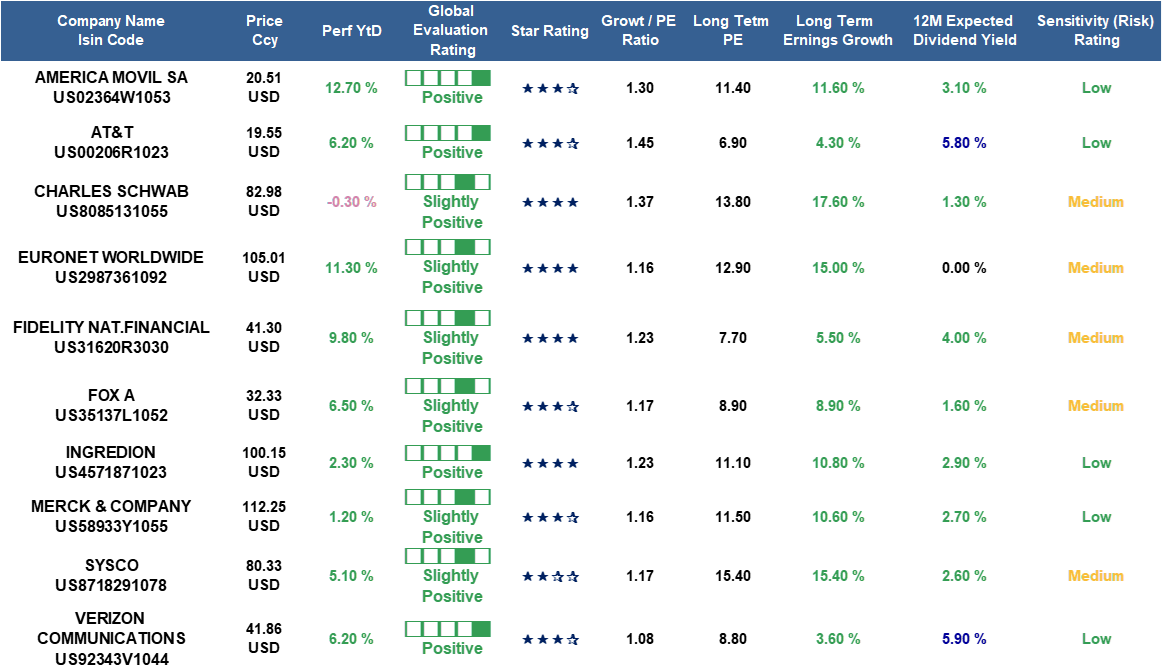
This is where Aurora can help you. With our consistent, transparent, and unbiased methodology, we analyze 6,000 stocks and evaluate them based on their fundamentals and their peer group.
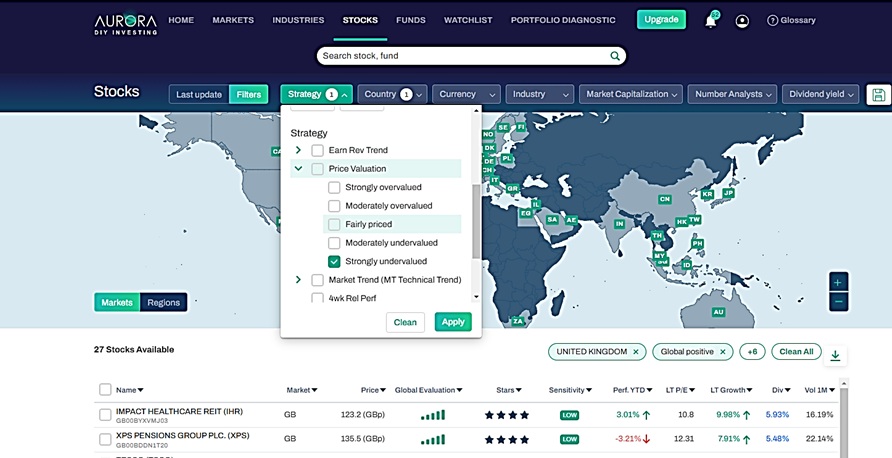
All you need to do is to search for these undervalued stocks and pick the one that meets your goals. After you identified the socks, you can conduct additional research with other sources and make your investment decision.
How we evaluate stocks
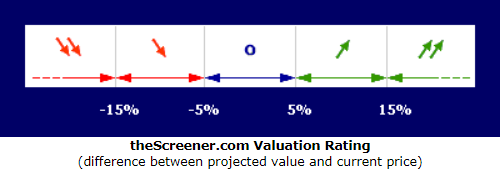
Our Valuation Rating indicates if a stock is selling at a relative premium or discount price, based on its growth potential.
To estimate a stock’s value relative to its current price our Valuation Rating combines:
| stock price; | |
| projected earnings; | |
| projected earnings growth; | |
| Dividends. |
By combining these elements we can establish a rating for the analyzed company.
There are five ratings, ranging from strongly undervalued [![]()
![]() ] to strongly overvalued [
] to strongly overvalued [![]()
![]() ] (see below).
] (see below).
When we analyze a company’s projected earnings growth, we place a certain emphasis on the G/PE Ratio. While the first two elements in our analysis are important and fairly simple to understand (stock price and earnings), the G/PE Ratio merits further explanation.
Some analysts watch the PE (Price Earnings ratio) – the ratio of stock price divided by earnings per share. In general, this ratio is fairly linear: a low PE suggests an inexpensive/low-Sensitivity stock, while a high PE suggests an expensive/high-Sensitivity stock.
In our model, the concepts of expensive/inexpensive do not depend on the PE, but on the relation between the PE and growth. Multifactor analysis has shown that the estimated growth of earnings provides the best base for the evaluation of a stock. There is approximately a 60% correlation of estimated earnings growth to stock value.
Our Growth to PE Ratio measure quickly evaluates a company and detects firms that offer the greatest relative potential for the future and are, therefore, the most undervalued. Correspondingly, our Growth to PE Ratio also detects firms that offer the least relative potential for the future and are thus, the most overvalued. Our Growth to PE Ratio measure conveniently compares two stocks at a glance. Our growth projections are always based on an average of at least three estimates.
The moment an investor buys a stock, the stock’s present situation becomes the past, and the success of the investment depends fully on the future. The Corporate focuses on the future in order to establish a true Valuation Rating.
Dividends
Dividend Yield:
Aurora is providing you the 12M expected dividend yield.
Payout ratio:
This is the dividend as a percentage of a company’s earnings. In general terms, the lower the payout ratio, the more sustainable a dividend should be. For example, if a company pays out $5 a share and has $10 of earnings, 5 divided by 10 is 0.5 – or 50 percent. The payout ratio is 50 percent.
In Aurora, the value of the dividend yield is black, green, blue, or red, depending on the payment rate relative to the annual profit in -%.
Black colored when payout = 0
Green colored when payout between 0 and 40% (0 < payout <= 40)
Blue colored when payout between 40% and 70% (40 < payout <= 70 )
Red colored when payout > 70%
What we offer
- Intuitive, user-friendly interface that saves you time.
- Analysis and ratings for 40 Stock markets, 100 Sectors, 6,000 Stocks, 15,000 Funds, and 1,200 ETFs.
- On-Line portfolio diagnostic and alerts to monitor and control your portfolio.
- All-In-One subscription for all markets and products.
- Twice-Weekly updates of our ratings and analysis so you can stay informed.
- Independent, transparent, unbiased research with no hidden motives, commissions, or costs.
- Analysis and ratings, Powered by theScreener AG Switzerland, trusted by leading financial institutions and asset managers for over 20 years.
Disclaimer
The system provides financial information and data to help you identify investment ideas. However, we do not advise you or guide you about this or what products to purchase or sell – these decisions are yours only. SDIS and the system are not subject to regulation, and SDIS does not hold a license for investment advisory, investment marketing, or investment portfolio management under any law. The content provided on the system is independent and not based or tailored to your circumstances, To your needs, or your purposes, and should not be relied on as an estimate of profitability or the suitability of an investment in a particular stock for any purpose. Past performance is not a guarantee of present or future performance. Investments may lose their full value.