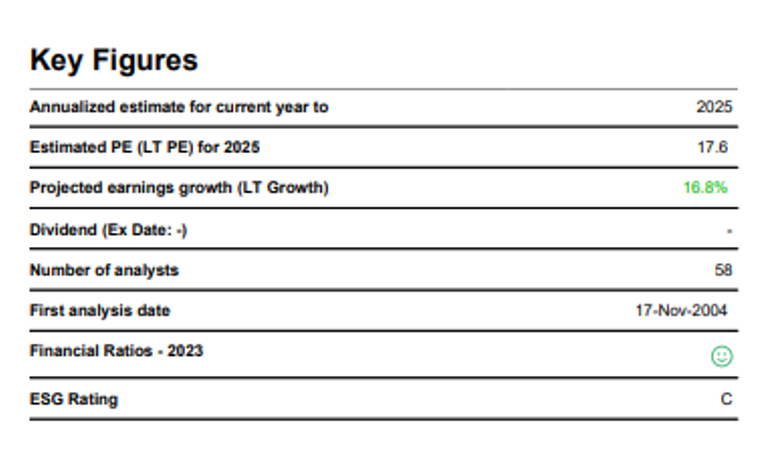
Nvidia (NASDAQ: NVDA) (682.23)
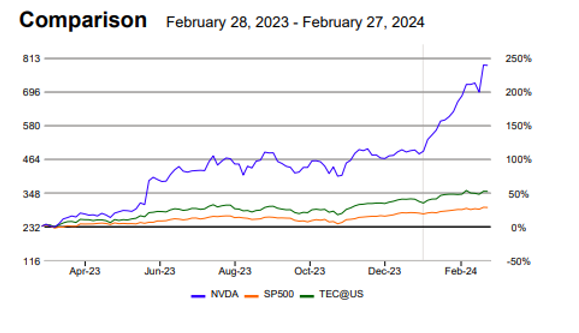
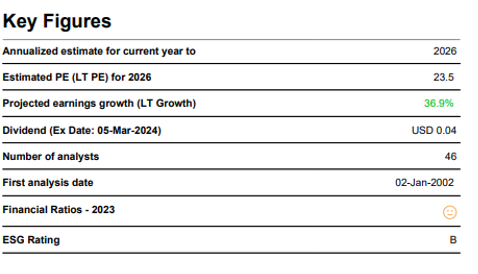
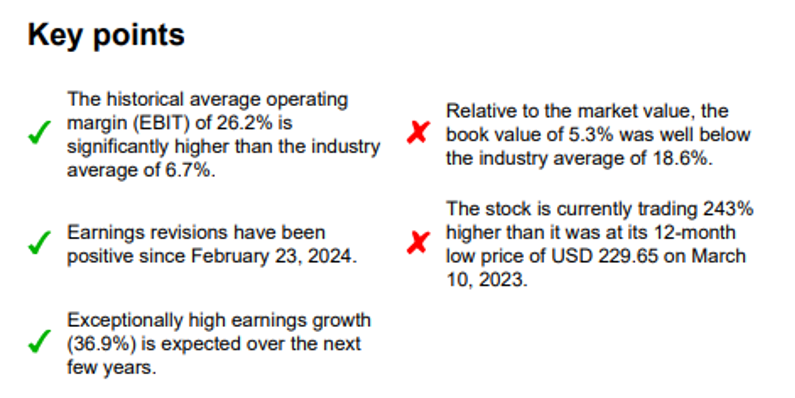
NVIDIA active in the sector Semiconductors, belongs to the industry group Technology. Its market capitalization of USD 1,977.30 bn. ranks it among large-cap stocks and 3 in the world, in its group. During the last 12 months this stock has reached a high of USD 788.17 and a low of USD 229.65; its current price of USD 787.01 places it near its 52 week high and 242.7% above its bottom. Performance since February 28, 2023: NVIDIA: 239.0%, Technology: 51.8%, SP500: 27.9%
Analysis (28-Feb-2024)
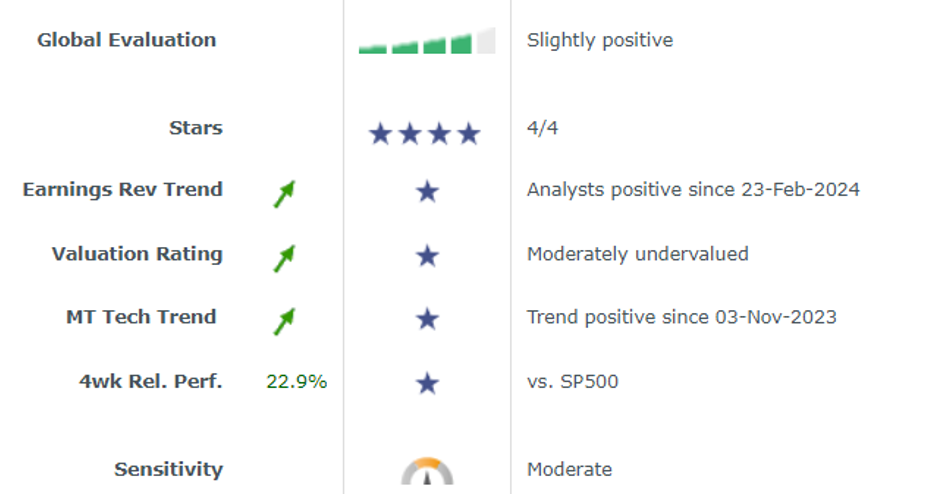
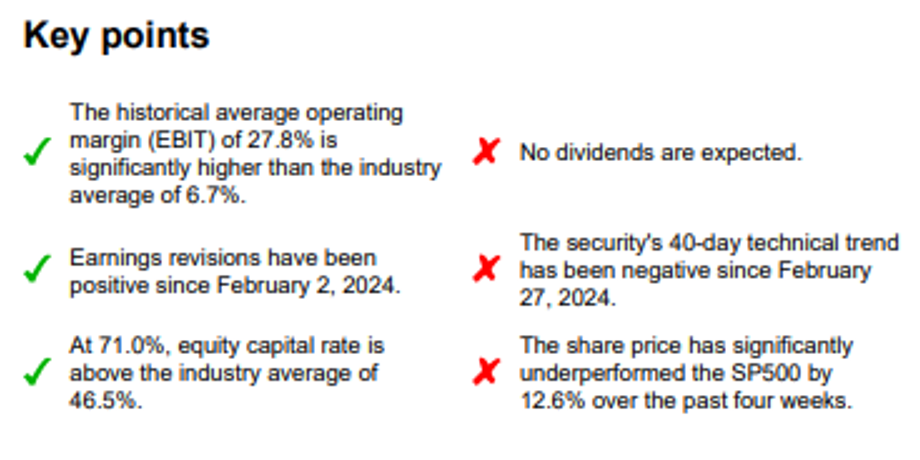
The stock meets all our stars. The market, analysts and fundamental analysis have shown positive signals. NVIDIA was considered attractive by the marketand also moved positively against the SP500 index. NVIDIA appears fundamentally undervalued compared to its theoretical fair price. Its valuation is comparable to the American Technology aggregate. Analysts were optimistic in revising earnings forecasts upwards. Currently, analysts are positively revising their earnings growth estimates
by 18.9% compared with seven weeks ago. This positive pressure on the growth expectations has been apparent since February 23, 2024. The situation in the sector environment is also pleasing and, with one star less, is only slightly worse. In the past, the share price has reacted to stressful situations with typical market price losses. Loss sensitivity is an important valuation criterion for us, just like the star rating. Taking into account this average loss sensitivity, we obtain an overall positive impression.
Tesla (NASDAQ: TSLA) (199.73)
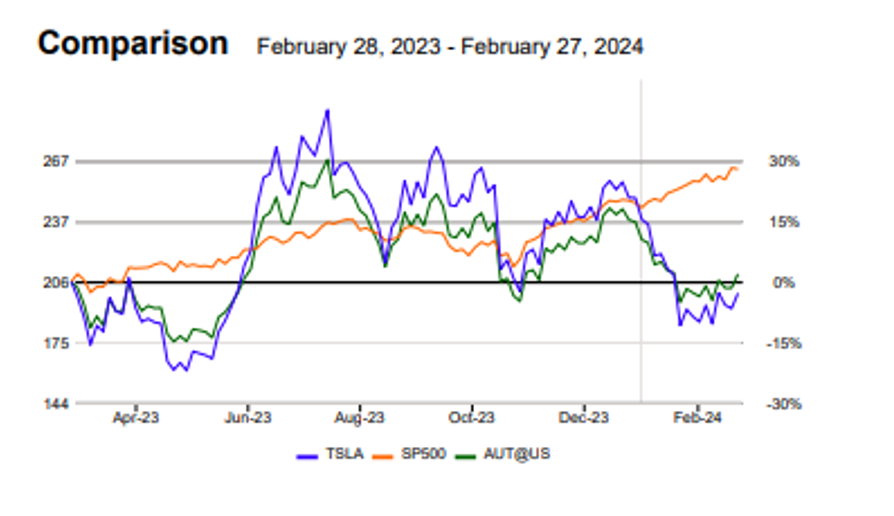
TESLA active in the sector Automobiles, belongs to the industry group Automobiles
& Parts. Its market capitalization of USD 635.05 bn. ranks it among large-cap stocks and # 1 in the world, in its group. During the last 12 months this stock has reached a high of USD 293.34 and a low of USD 160.31; its current price of USD 199.73 places it 31.9% under its 52 week high and 24.6% over its 52 week low. Performance since February 28, 2023: TESLA: -2.9%, Automobiles & Parts: 1.9%, SP500: 27.9%
Analysis (28-Feb-2024)
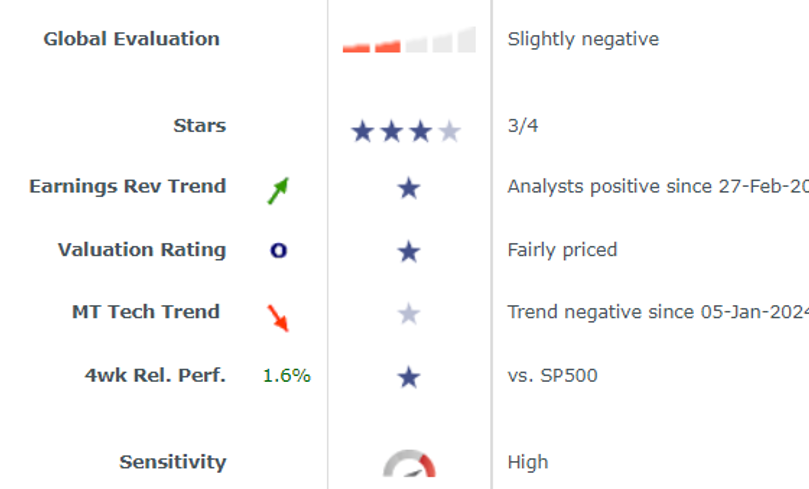
The stock currently meets three of our four stars. TESLA appears fundamentally fairly valued compared to its theoretical fair price. Its valuation is more attractive than the American Automobiles & Parts aggregate.
The fundamental price potential for TESLA looks reasonable, and better than the average of its industry group. In addition, the share price has performed creditably against the SP500 index over the past four weeks. Over 40 days, however, the price trend is devoid of momentum. Currently, analysts are positively revising their earnings growth estimates by 1.6% compared with seven weeks ago, when the revisions were negative. This turnaround on the growth expectations has been apparent since February 27, 2024. The situation in the sector environment is, with only one star criterion met, rather unfavourable. Part of the positive situation is company specific. In the past, the share price has reacted to stress signals with above-average price losses. According to estimates, no dividend is foreseen in the next 12 months.
Meta Platforms (NASDAQ: META) (487.05)
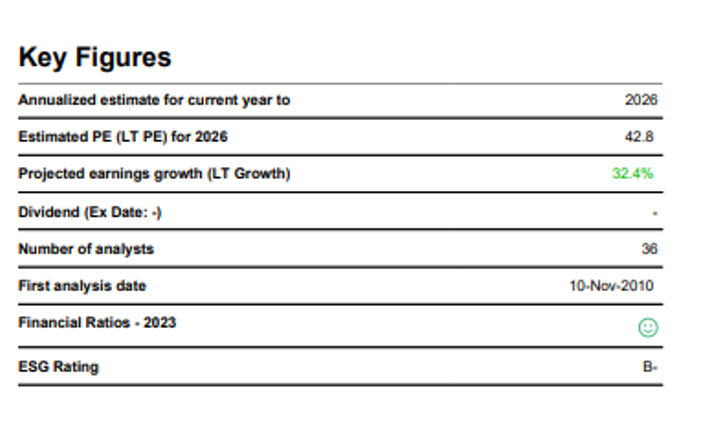
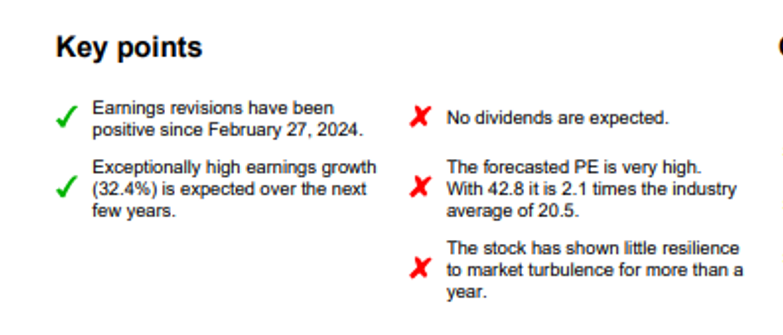
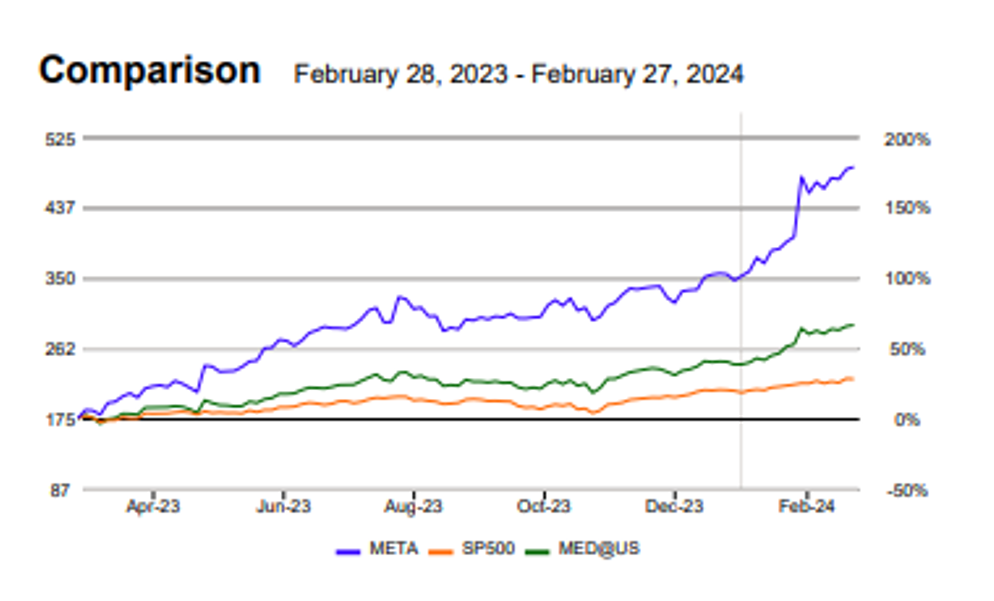
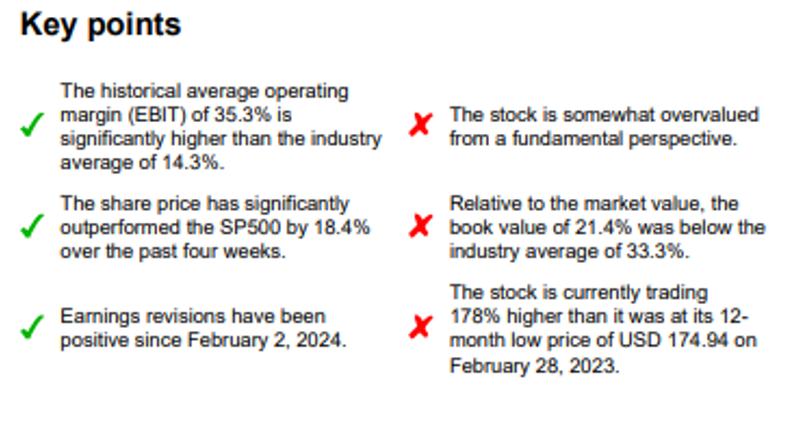
META PLATFORMS INC active in the sector Broadcasting & Entertainment, belongs to the industry group Media. Its market capitalization of USD 1,228.15 bn. ranks it among large-cap stocks and 1 in the world, in its group During the last 12 months this stock has reached a high of USD 487.05 and a low of USD 174.94; its current price of USD 487.05 places it near its 52 week high and 178.4% above its bottom. Performance since February 28, 2023: META PLATFORMS INC: 178.4%, Media: 66.3%, SP500: 27.9%
Analysis (28-Feb-2024)
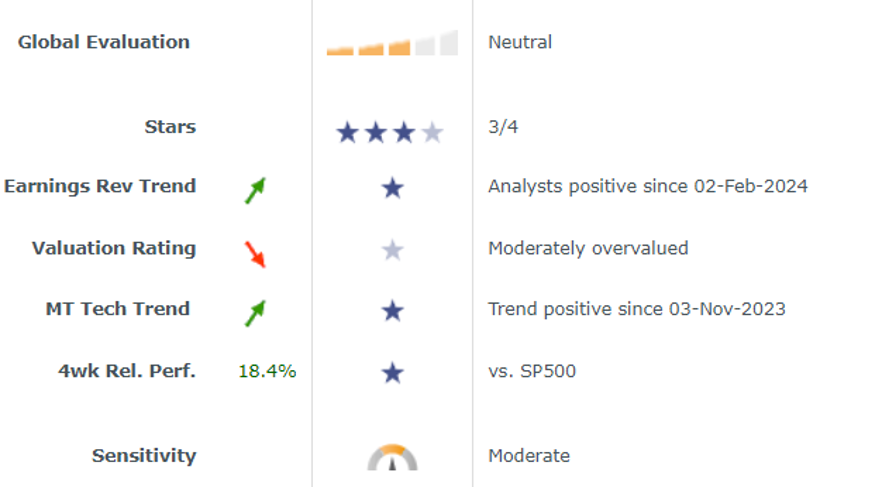
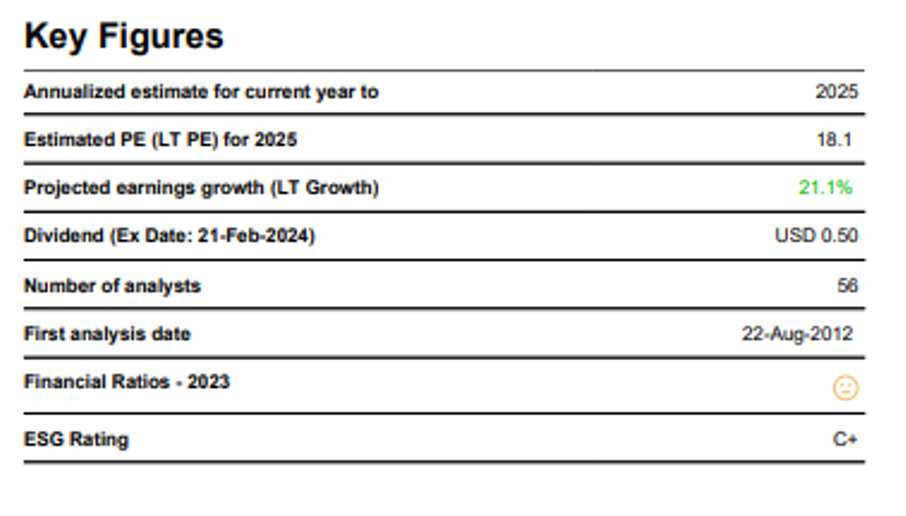
The stock currently meets three of our four stars. In addition to the positive absolute and relative market signals, analysts also endorse the stock. From a fundamental perspective, however, the stock has a rather high valuation. The situation in the sectoral environment is even slightly more favourable, with four star criteria met. Currently, analysts are positively revising their earnings growth estimatesby 32.9% compared with seven weeks ago. This positive pressure on the growth expectations has been apparent since February 2, 2024. In the past, the share price has reacted to stressful situations with typical market price losses. The 12-month indicated dividend yield is 0.4%. This estimated dividend represents 7.4% of the estimated earnings. Consequently, the dividend is easily covered, and very likely to prove sustainable.
Apple (NASDAQ: AAPL) (182.63)
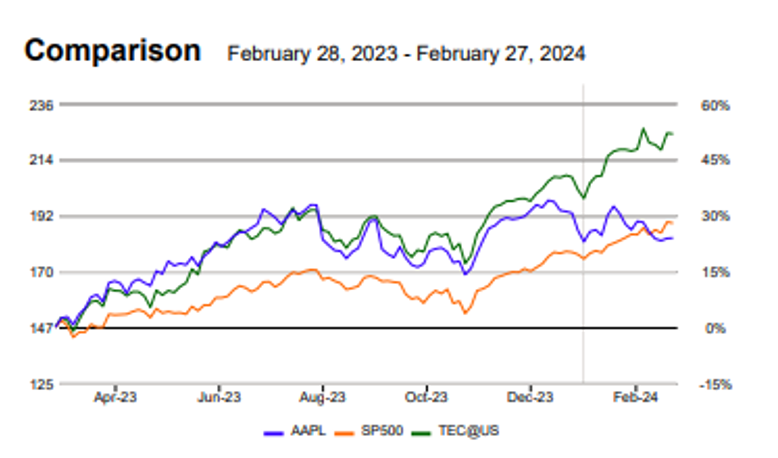
APPLE active in the sector Computer Hardware, belongs to the industry group Technology. Its market capitalization of USD 2,797.45 bn. ranks it among large-cap stocks and 2 in the world, in its group. During the last 12 months this stock has reached a high of USD 197.57 and a low of USD 147.41; its current price of USD 182.63 places it 7.6% under its 52 week high and 23.9% over its 52 week low. Performance since February 28, 2023: APPLE: 23.9%, Technology: 51.8%, SP500: 27.9%
Analysis (28-Feb-2024)

The stock currently meets only one of our four stars in the form of stable analyst earnings expectations. On the other hand, market signals in recent weeks have been mostly negative and the stock price was above its fundamental fair value as of February 27, 2024. APPLE appears fundamentally overvalued compared to its theoretical fair price. Its valuation is less attractive than the American Technology aggregate.Currently, analysts are slightly lowering their earnings growth estimates by -0.3%; nevertheless, the trend remains favorable because the last significant trend (i. e. a figure > +1% or < -1%) is positive. This positive pressure on the growth expectations has been continuous over the past 12 months.
The sector environment looks more positive with three stars. Some of the negative situation is therefore company specific. In the past, the share price has reacted to stressful situations with typical market price losses. The 12-month indicated dividend yield is 0.6%. This estimated dividend represents 14.1% of the estimated earnings. Consequently, the dividend is easily covered, and very likely to prove sustainable.
Amazon (NASDAQ: AMZN) (173.54)
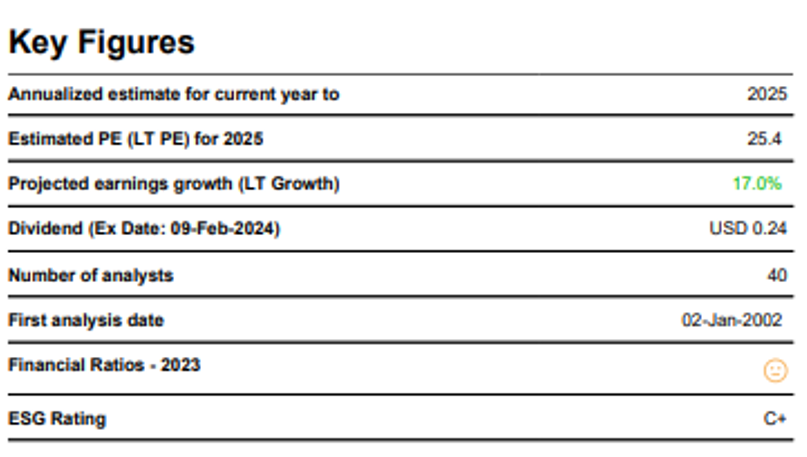
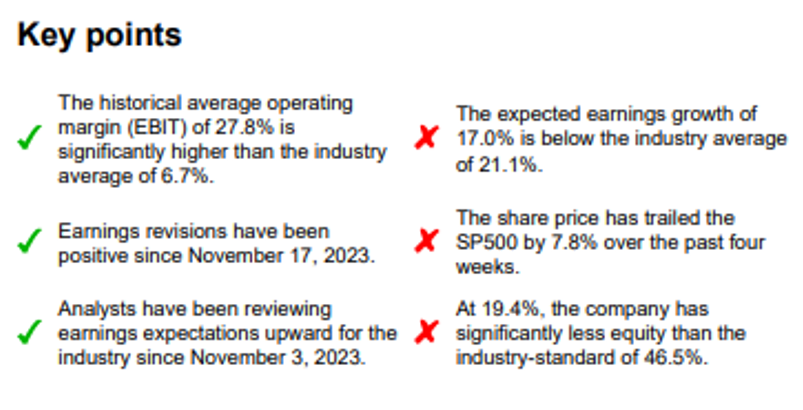
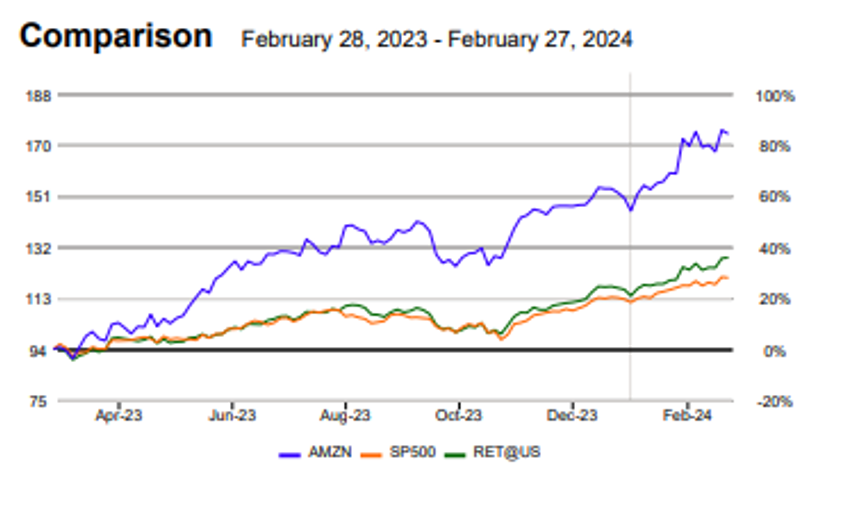
AMAZON.COM active in the sector Broadline Retailers, belongs to the industry group Retail. Its market capitalization of USD 1,814.99 bn. ranks it among large-cap stocks and 1 in the world, in its group. During the last 12 months this stock has reached a high of USD 174.99 and a low of USD 90.73; its current price of USD 173.54 places it near its 52 week high and 91.3% above its bottom. Performance since February 28, 2023: AMAZON.COM: 84.2%, Retail: 35.8%, SP500: 27.9%
Analysis (28-Feb-2024)
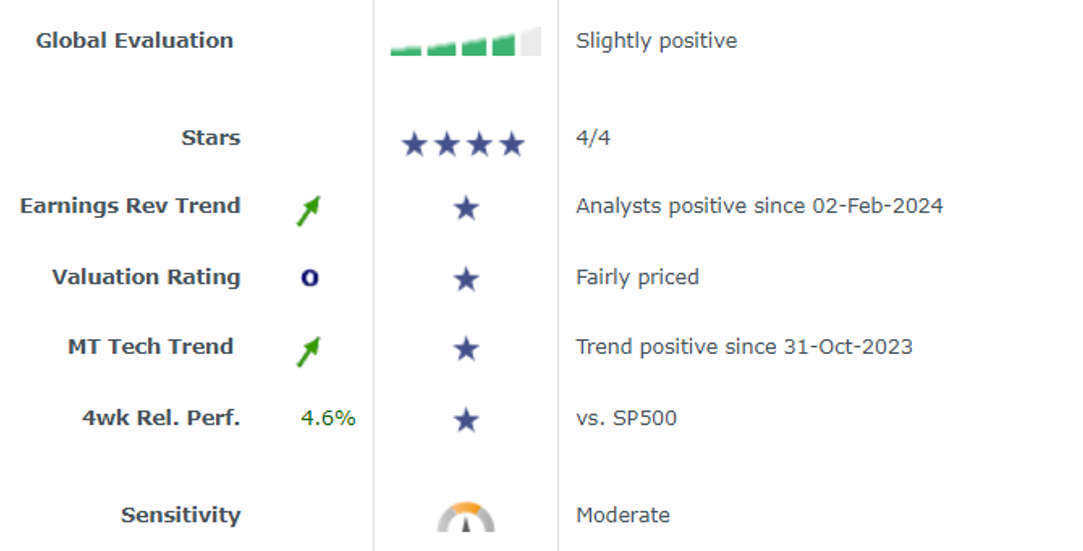
The stock meets all our stars. The market, analysts and fundamental analysis have shown positive signals. AMAZON.COM was considered attractive by the market and also moved positively against the SP500 index. AMAZON.COM appears fundamentally fairly valued compared to its theoretical fair
price its valuation is less attractive than the American Retail aggregate. The fundamental price potential for AMAZON.COM looks reasonable. A nalysts were optimistic in revising earnings forecasts upwards. Currently, analysts are positively revising their earnings growth estimates by 53.6% compared with seven weeks ago. This positive pressure on the growth expectations has been apparent since February 2, 2024. This pleasing situation is not specific to the company, but is also reflected in the sectoral environment in general. In the past, the share price has reacted to stressful situations with typical market price losses. According to estimates, no dividend is foreseen in the next 12 months.
Microsoft (NASDAQ: MSFT) (407.48)
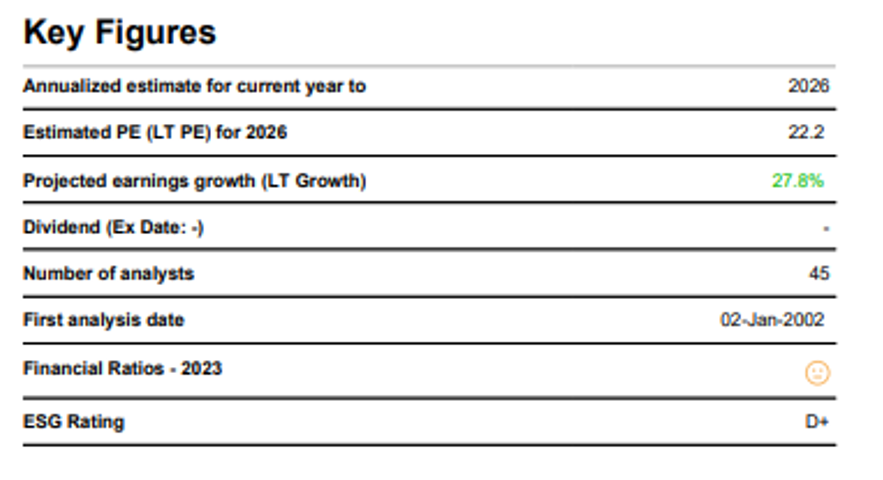
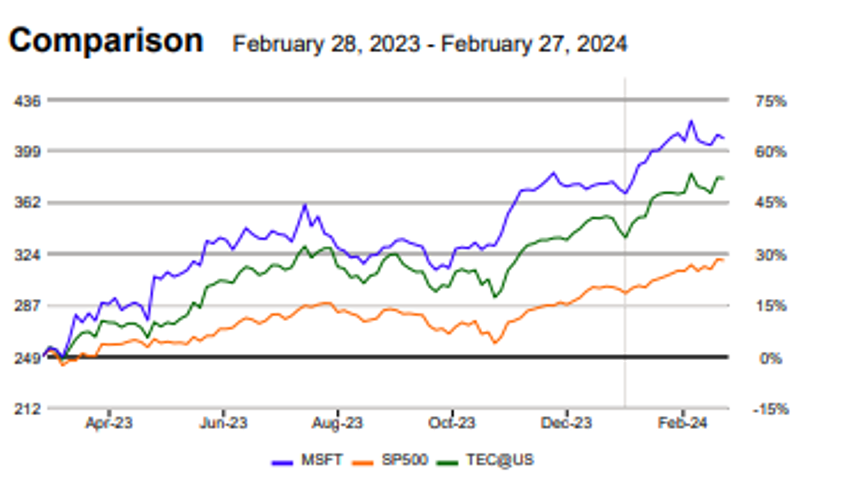
MICROSOFT active in the sector Software, belongs to the industry group Technology. Its market capitalization of USD 3,028.20 bn. ranks it among large-cap stocks and 1 in the world, in its group.During the last 12 months this stock has reached a high of USD 420.55 and a low of USD 248.59; its current price of USD 407.48 places it 3.1% under its 52 week high and 63.9% over its 52 week low. Performance since February 28, 2023: MICROSOFT: 63.4%, Technology: 51.8%, SP500: 27.9%
Analysis (28-Feb-2024)
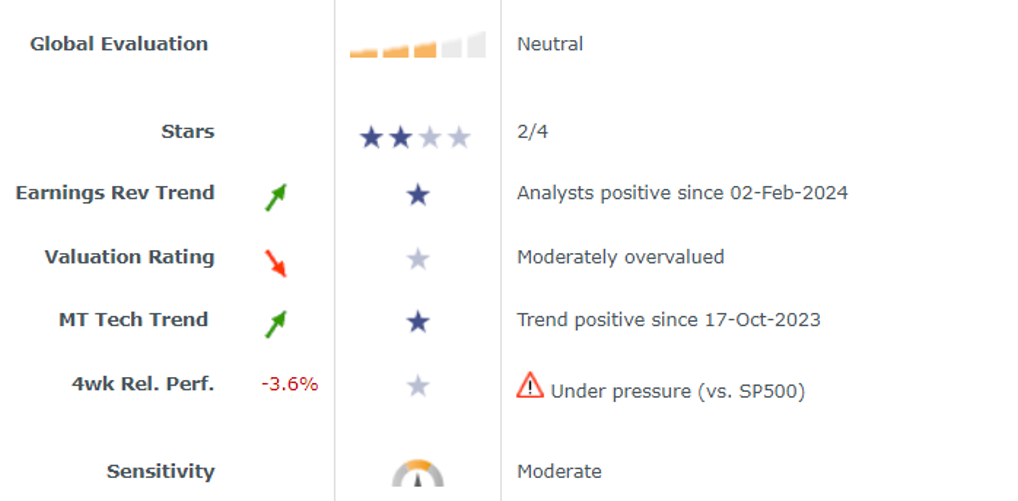
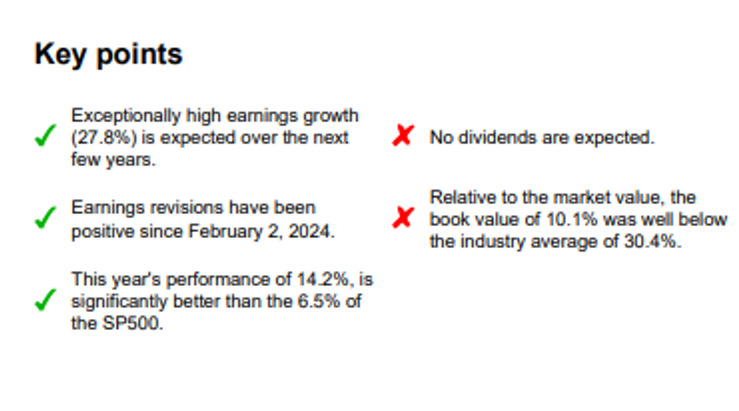
The stock currently meets two of our four stars. Analysts were bullish in adjusting their earnings forecasts upwards by 6.7% and the market entered MICROSOFT in a bullish trend. However, the price failed to outperform the SP500 index and the stock was not cheap from a fundamental perspective on February 27, 2024. The sector environment looks a little more favourable, currently with three stars. In the past, the share price has reacted to stressful situations with typical market price losses. Loss sensitivity is an important valuation criterion for us, just like the star rating. Taking into account this average loss sensitivity, we obtain an overall neutral impression. The 12-month indicated dividend yield is 0.8%. This estimated dividend represents 19.7% of the estimated earnings. Consequently, the dividend is easily covered, and very likely to prove sustainable.
Alphabet (NASDAQ: GOOGL) (138.88)
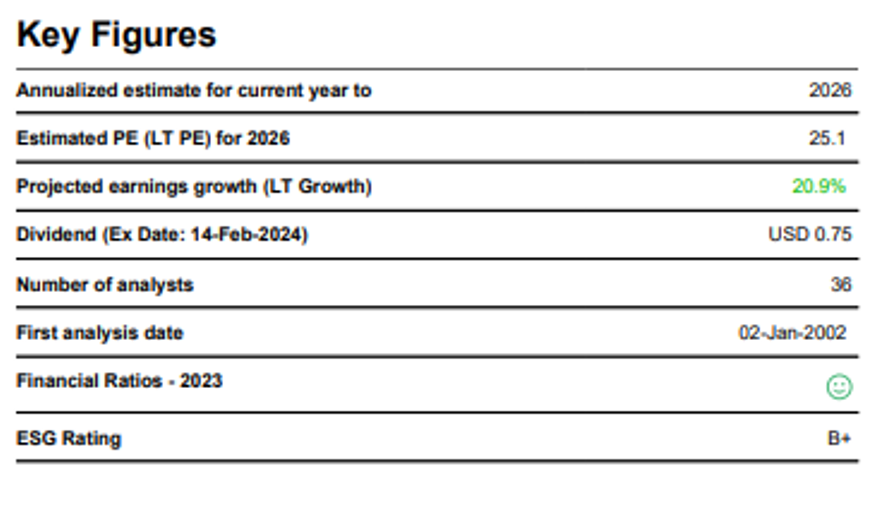
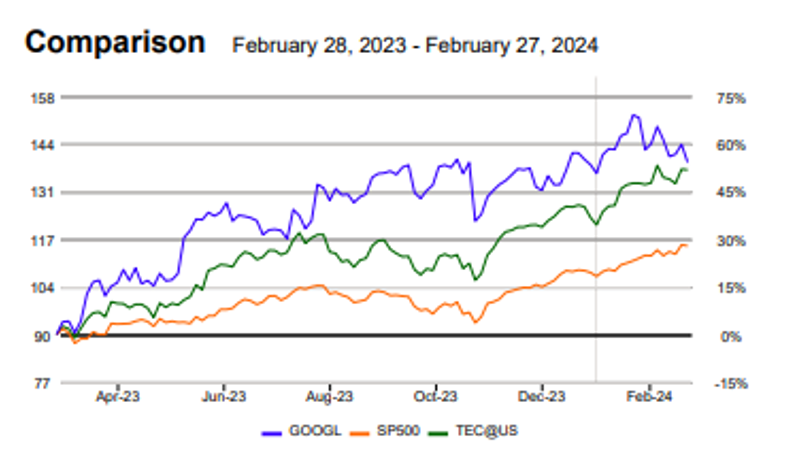
ALPHABET INC active in the sector Internet, belongs to the industry group Technology. Its market capitalization of USD 1,717.10 bn. ranks it among large-cap stocks and 4 in the world, in its group. During the last 12 months this stock has reached a high of USD 152.19 and a low of USD 90.06; its current price of USD 138.88 places it 8.7% under its 52 week high and 54.2% over its 52 week low. Performance since February 28, 2023: ALPHABET INC: 54.2%, Technology: 51.8%, SP500: 27.9%
Analysis (28-Feb-2024)
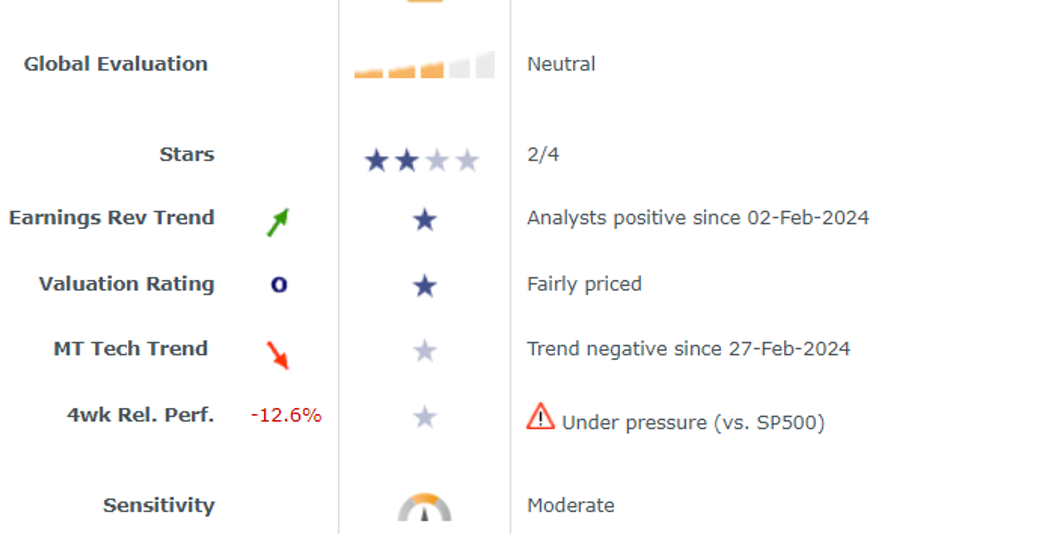
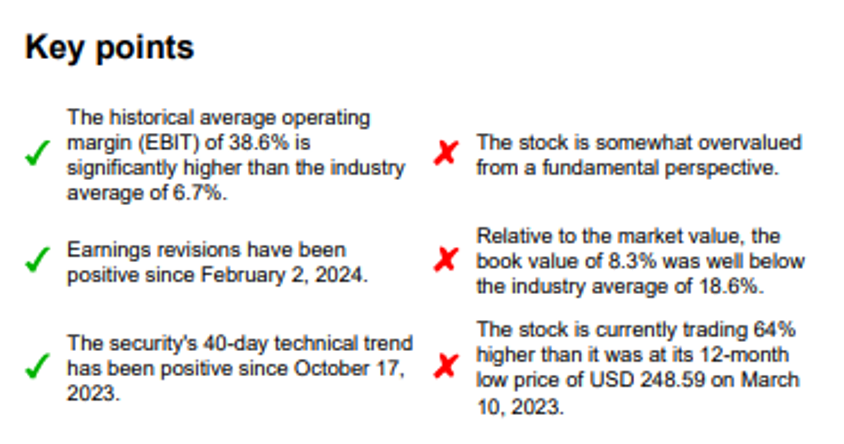
The stock currently meets two of our four stars. Analysts have been bullish in revising earnings forecasts upwards and the share price was at fair fundamental value on February 27, 2024. From a technical perspective, however, the stock is under pressure. Recently, the price has failed to break away from the SP500 index, the market has found the stock unattractive. ALPHABET INC appears fundamentally fairly valued compared to its theoretical fair price. Its valuation is less attractive than the American Technology aggregate. The fundamental price potential for ALPHABET INC looks reasonable. Currently, analysts are positively revising their earnings growth estimates by 3.0% compared with seven weeks ago. This positive pressure on the growth expectations has been apparent since February 2, 2024. The sector environment looks a little more favourable, currently with three stars. In the past, the share price has reacted to stressful situations with typical market price losses. According to estimates, no dividend is foreseen in the next 12 months.
