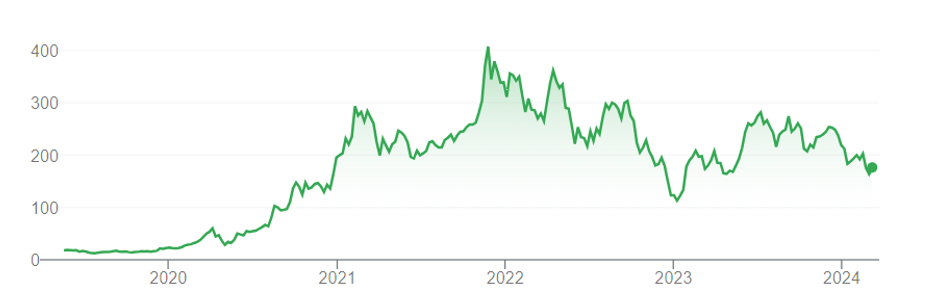
Tesla (TSLA) (USD 171.32)
Tesla, Inc. designs, develops, manufactures, leases, and sells electric vehicles, and energy generation and storage systems in the United States, China, and internationally. Tesla, Inc. was incorporated in 2003 and is headquartered in Austin, Texas. Its market capitalization of USD 553.52 bn. ranks it among large-cap stocks and # 1 in the world, in its group. During the last 12 months this stock has reached a high of USD 293.34 and a low of USD 160.31; its current price of USD 171.32 places it 41.6% under its 52-week high and 6.9% over its 52-week low. Performance since March 17, 2023: TESLA: -4.9%, Automobiles & Parts: 7.0%, SP500: 32.2%
Analysis
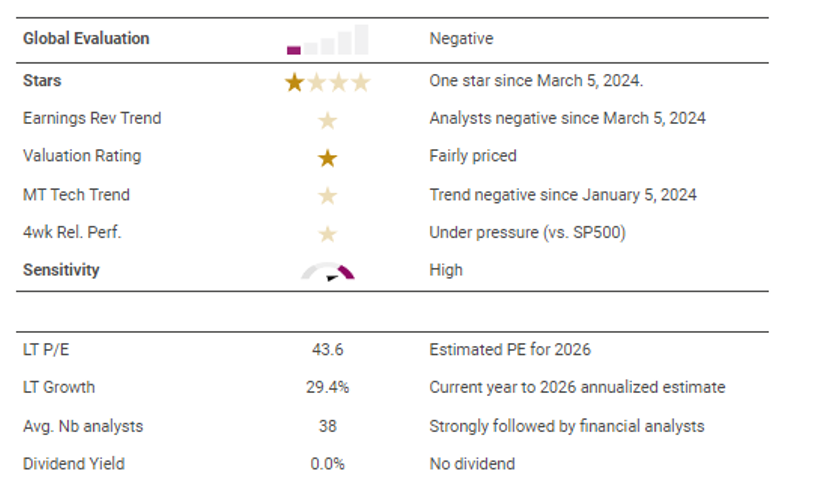
The stock currently meets only one of our four stars. Its price looks reasonable from a fundamental perspective. However, analysts have lowered their earnings forecasts in recent weeks and the technical signals from the market are mostly negative. The situation in the sectoral environment, with no star criteria fulfilled, is even slightly less favorable. In the past, the share price has reacted to stress signals with above-average price losses.
Valuation
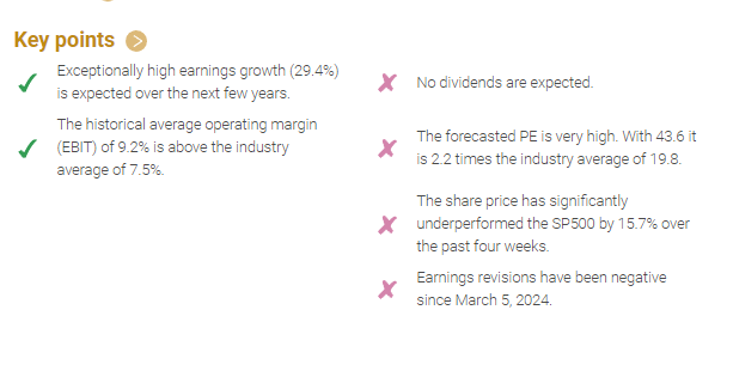
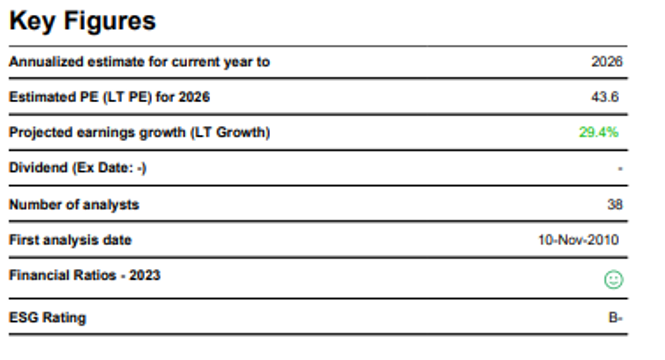
TESLA appears fundamentally fairly valued compared to its theoretical fair price. Its valuation is more attractive than the American Automobiles & Parts aggregate. The forecasted PE is very high. With 43.6 it is 2.2 times the industry average of 19.8. The fundamental price potential for TESLA looks reasonable, and better than the average of its industry group.
Earnings
TESLA is strongly followed by financial analysts, as over the last three months an average of 38 analysts provided earnings estimate forecasts up until the year 2026. Exceptionally high earnings growth (29.4%) is expected over the next few years. Currently, these analysts are negatively revising their earnings growth estimates by -18.1% compared with seven weeks ago. This negative pressure on the growth expectations has been apparent since March 5, 2024. The historical average operating margin (EBIT) of 9.2% is above the industry average of 7.5%.
Dividend
Dividend According to estimates, no dividend is foreseen in the next 12 months.
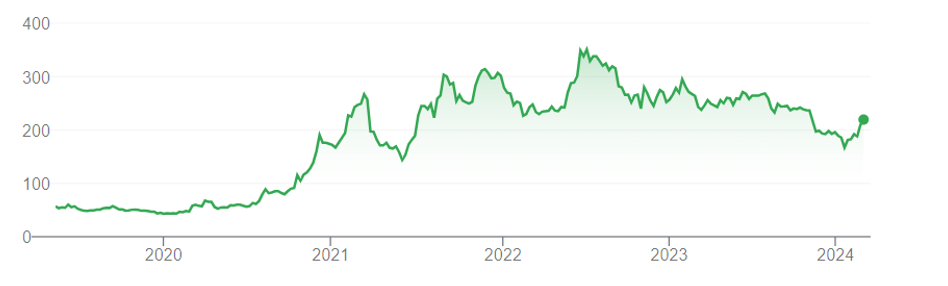
BYD (002594) (CNY 218.91)
BYD Company Limited, together with its subsidiaries, engages in the research, development, manufacture, and sale of automobiles and related products in the People’s Republic of China and internationally. The company was founded in 1995 and is headquartered in Shenzhen, China. Its market capitalization of USD 83.67 bn. ranks it among large-cap stocks and # 7 in the world, in its group. During the last 12 months, this stock has reached a high of CNY 271.50 and a low of CNY 167.00; its current price of CNY 216.80 places it 20.1% under its 52-week high and 29.8% over its 52-week low. Performance since March 17, 2023: BYD COMPANY LTD: -8.9%, Automobiles & Parts: 25.3%, Shanghai A: -5.8%.
Analysis
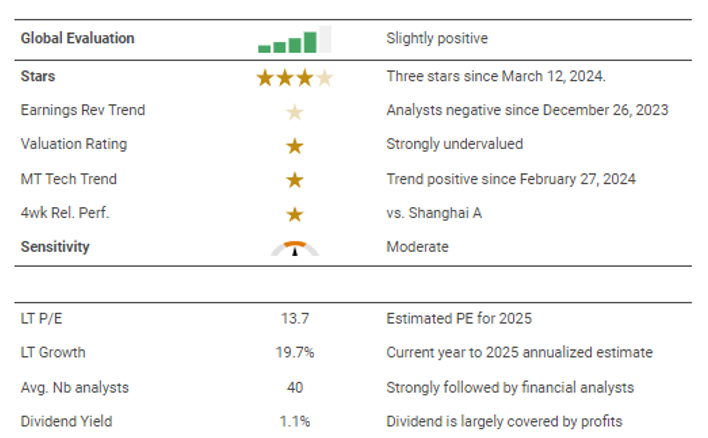
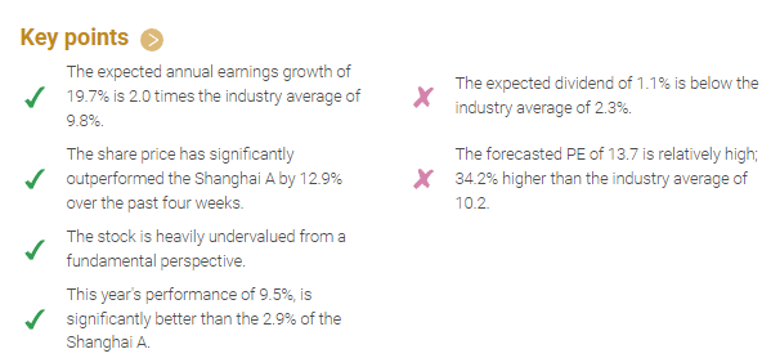
The stock currently meets three of our four stars. Positive market signals in absolute and relative terms are balanced by negative analyst signals. Fundamental analysis shows price potential intact. The situation in the sectoral environment is even slightly more favorable, with four-star criteria met. In the past, the share price has reacted to stressful situations with typical market price losses.
Valuation
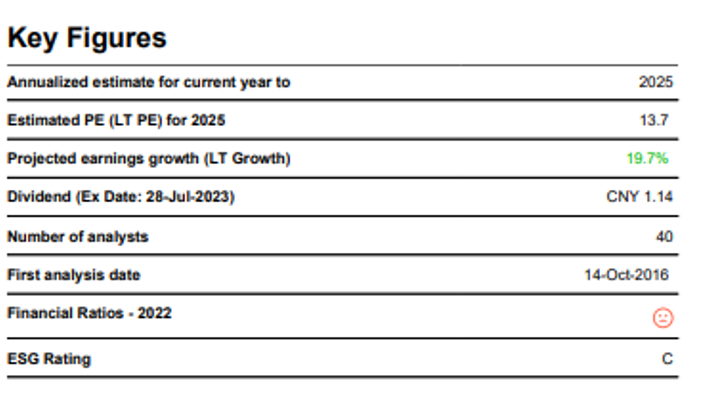
BYD COMPANY LTD appears fundamentally much undervalued compared to its theoretical fair price. – Its valuation is comparable to the World Automobiles & Parts aggregate. The fundamental price potential for BYD COMPANY LTD looks good and in line with the average of its industry group. The forecasted PE of 13.7 is relatively high; 34.2% higher than the industry average of 10.2.
Earnings
BYD COMPANY LTD is strongly followed by financial analysts, as over the last three months an average of 40 analysts provided earnings estimate forecasts up until the year 2025. The expected annual earnings growth of 19.7% is 2.0 times the industry average of 9.8%. Currently, these analysts are negatively revising their earnings growth estimates by -11.8% compared with seven weeks ago. This negative pressure on the growth expectations has been apparent since December 26, 2023.
Dividend
The 12-month indicated dividend yield is 1.1%. This estimated dividend represents 14.9% of the estimated earnings. Consequently, the dividend is easily covered, and very likely to prove sustainable.
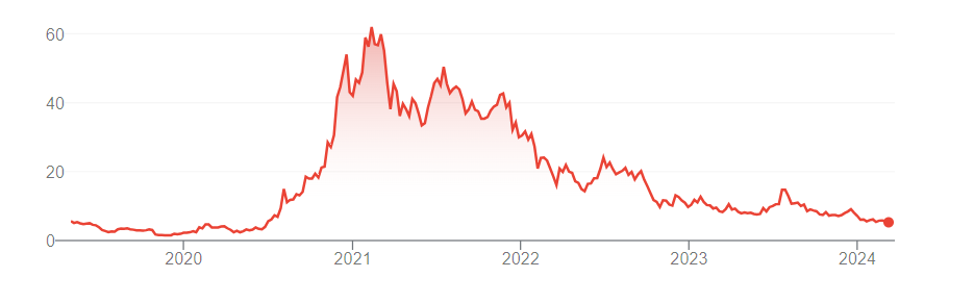
NIO (NIO) (USD 5.19)
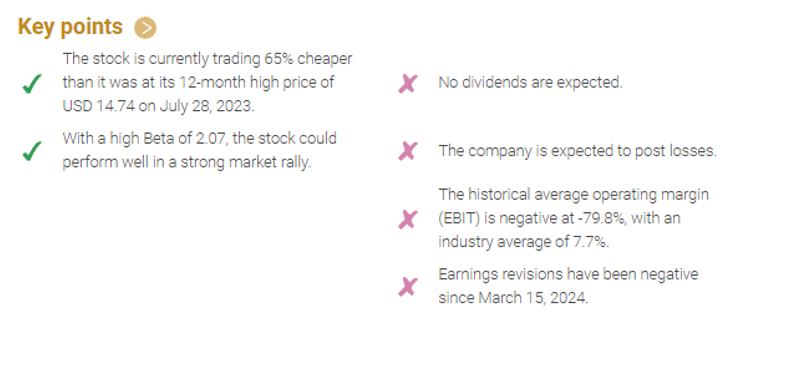
NIO Inc. designs, develops, manufactures, and sells smart electric vehicles in China. It offers five and six-seater electric SUVs, as well as smart electric sedans. NIO Inc. was incorporated in 2014 and is headquartered in Shanghai, China. Its market capitalization of USD 10.06 bn. ranks it among large-cap stocks. During the last 12 months this stock has reached a high of USD 14.74 and a low of USD 5.19; its current price of USD 5.19 places it 64.8% under its 52-week high and near its bottom. Performance since March 17, 2023: NIO INC: -37.2%, Automobiles & Parts: 7.0%, SP500: 32.2%.
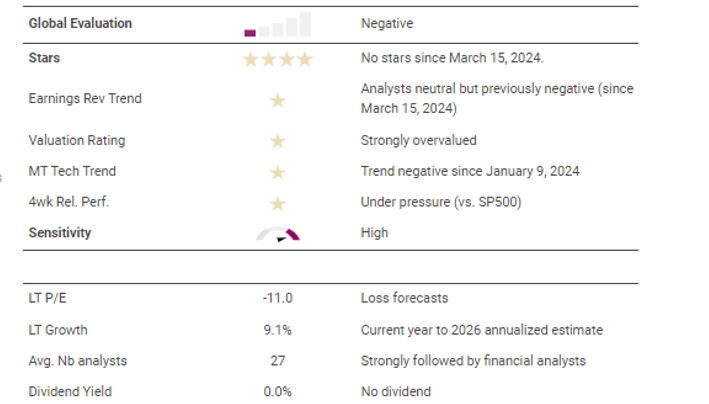
Analysis
The stock does not currently meet any of our four stars. It has not been supported by either the market or analysts in recent weeks. In terms of price, however, the stock is not a bargain, with its price above its fundamental fair value. This unfriendly situation is not specific to the company but is also reflected in the sector environment in general. In the past, the share price has reacted to stress signals with above-average price losses.
Valuation
NIO INC appears fundamentally overvalued compared to its theoretical fair price. – Its valuation is less attractive than the American Automobiles & Parts aggregate. The fundamental price potential for NIO INC looks rather low, with other stocks in the same industry showing more theoretical potential. With a high Beta of 2.07, the stock could perform well in a strong market rally.
Earnings
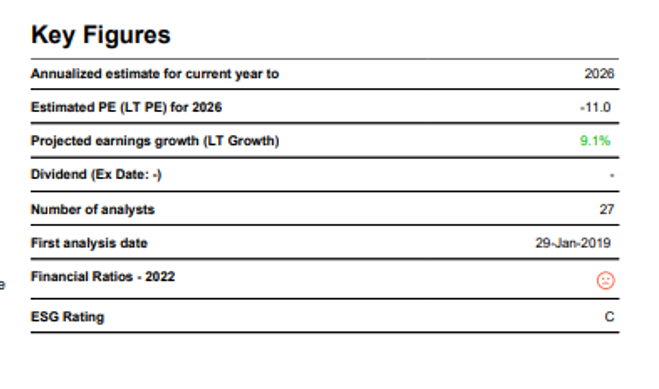
NIO INC is strongly followed by financial analysts, as over the last three months an average of 27 analysts provided earnings estimate forecasts up until the year 2026. The historical average operating margin (EBIT) is negative at -79.8%, with an industry average of 7.7%. Currently, these analysts are slightly lowering their earnings growth estimates by -0.5% compared with seven weeks ago. This negative pressure on the growth expectations has been continuous over the past 12 months.
Dividend
According to estimates, no dividend is foreseen in the next 12 months.
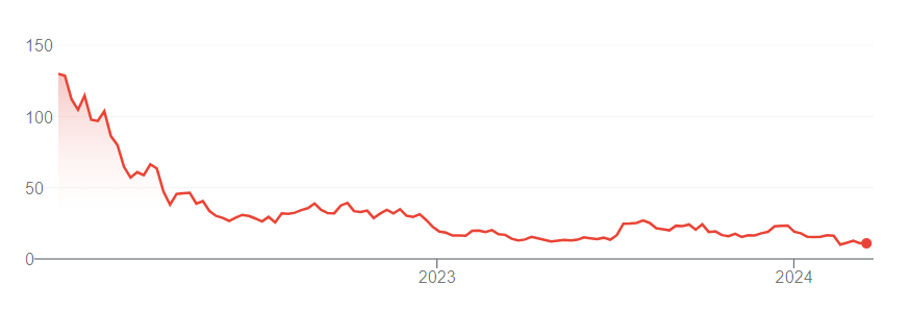
RIVIAN (RIVN) (USD 11.26)
Rivian Automotive, Inc., together with its subsidiaries, designs, develops, manufactures, and sells electric vehicles and accessories. Rivian Automotive, Inc. was founded in 2009 and is based in Irvine, California. Its market capitalization of USD 11.14 bn. ranks it among large-cap stocks. Since March 17, 2023, this stock has reached a high of USD 27.30 and a low of USD 10.07; its current price of USD 11.26 places it 58.8% under its 52-week high and 11.8% over its 52-week low. Performance since March 17, 2023: RIVIAN AUTOMOTIVE A: -13.5%, Automobiles & Parts: 7.0%, SP500: 32.2%.
Analysis
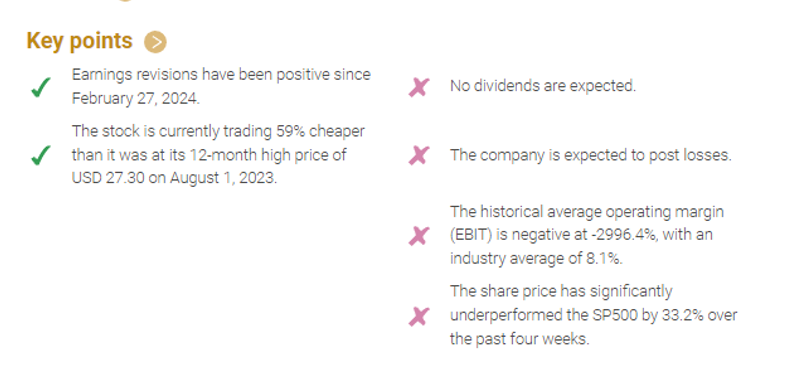
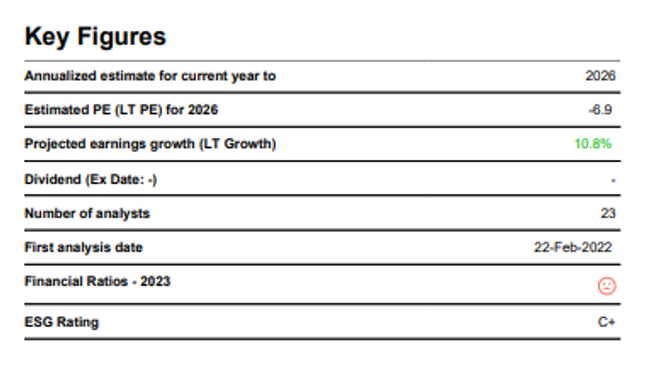
The stock currently meets only one of our four stars in the form of upwardly revised analyst earnings forecasts. In contrast, market signals in recent weeks have been mostly negative and the stock price was above its fundamental fair value as of March 19, 2024. The situation in the sectoral environment, with no star criteria fulfilled, is even slightly less favorable. In the past, the share price has reacted to stress signals with above-average price losses.
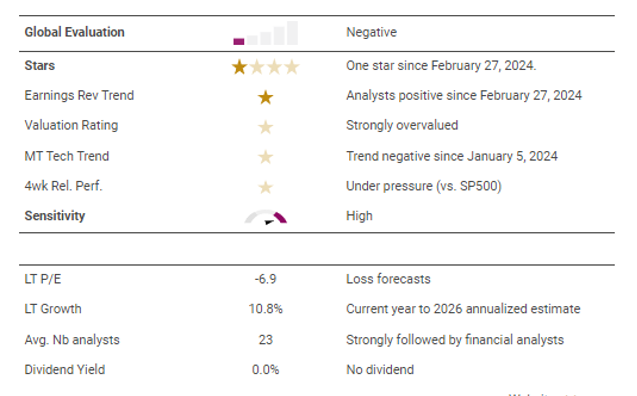
Valuation
RIVIAN AUTOMOTIVE A appears fundamentally much overvalued compared to its theoretical fair price. – Its valuation is less attractive than the American Automobiles & Parts aggregate. The fundamental price potential for RIVIAN AUTOMOTIVE A looks rather low, with other stocks in the same industry showing more theoretical potential. The estimated PE -6.9 is negative: the financial analysts’ earnings estimates forecast a loss.
Earnings
RIVIAN AUTOMOTIVE A is strongly followed by financial analysts, as over the last three months an average of 23 analysts provided earnings estimate forecasts up until the year 2026. The annualized growth estimate of 10.8% is for the current year to 2026. Currently, these analysts are positively revising their earnings growth estimates by 26.0% compared with seven weeks ago. The historical average operating margin (EBIT) is negative at -2996.4%, with an industry average of 8.1%.
Dividend
According to estimates, no dividend is foreseen in the next 12 months.
Disclaimer
The system provides information and financial data to help you identify investment ideas. However, we do not advise or guide you in this regard, or provide recommendations on what products to buy or sell – these decisions are yours alone. SDIS and the system are not subject to regulation, and SDIS does not hold a license for investment advice, investment marketing or management of investment portfolios under any law.
The content provided in the system is independent and is not based on or tailored to your personal circumstances, needs or purposes, and should not be relied upon as an assessment of the profitability or suitability of investing in a particular stock for any purpose. Past performance is no guarantee of present or future performance. Investments can lose their full value.