Markets are contending with inflation rates at 40-year highs, Russia’s invasion of Ukraine, supply chain kinks and food shortages, rising interest rates, widespread predictions of a recession, and former Fed leaders openly questioning the actions of the current regime. In 2022 The NASDAQ100 was falling by 22% and is currently trading at 24% below its 52-week high and 8% above its low. Performance since May 28, 2021: -7.3% vs. -1.1% for the STOXX600 and -1.1% for the SP500.
Many investors are concerned about how their portfolios may be affected. Aurora’s ratings can support investors to reduce the impact of bear markets.
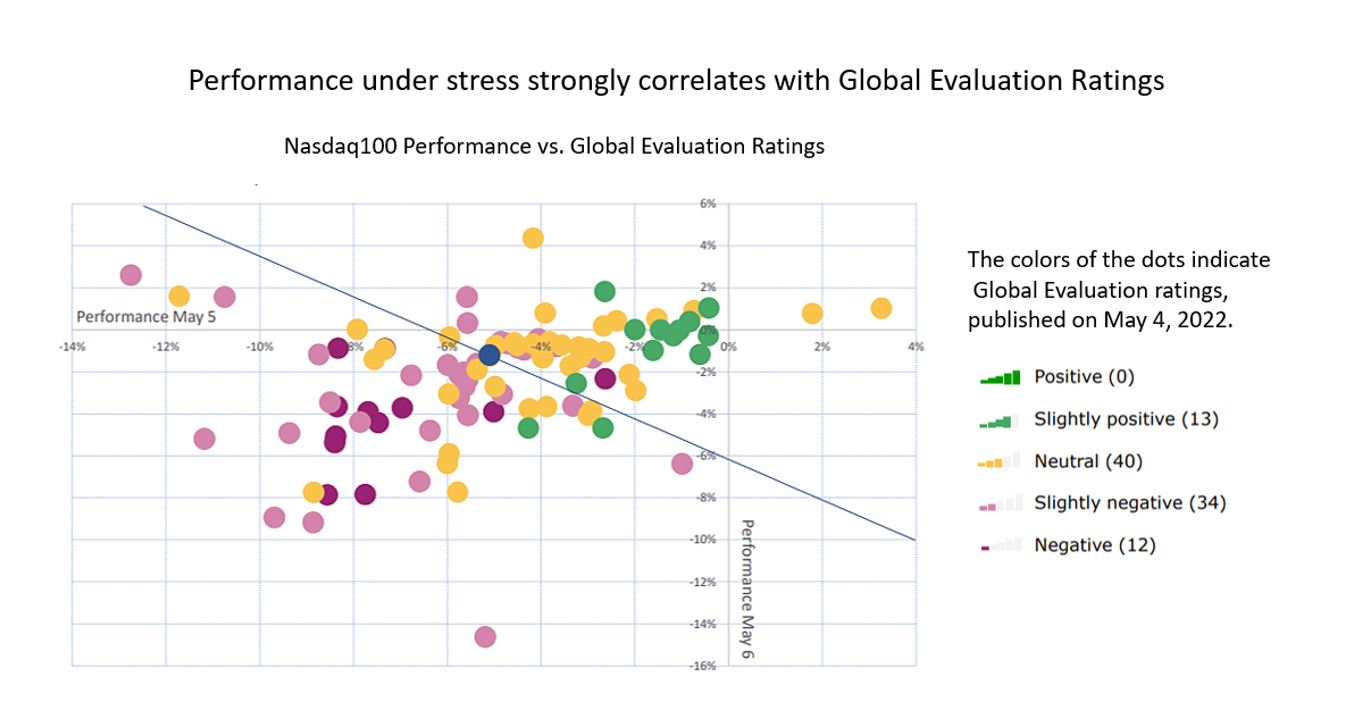
Our ratings prove highly accurate
On Thursday, May 5, the NASDAQ dramatically plunged 5.06%, followed by another 1.22% on Friday. Investors who acted according to our “Global Evaluation” Ratings on Wednesday, drastically outperformed in the subsequent downturn.
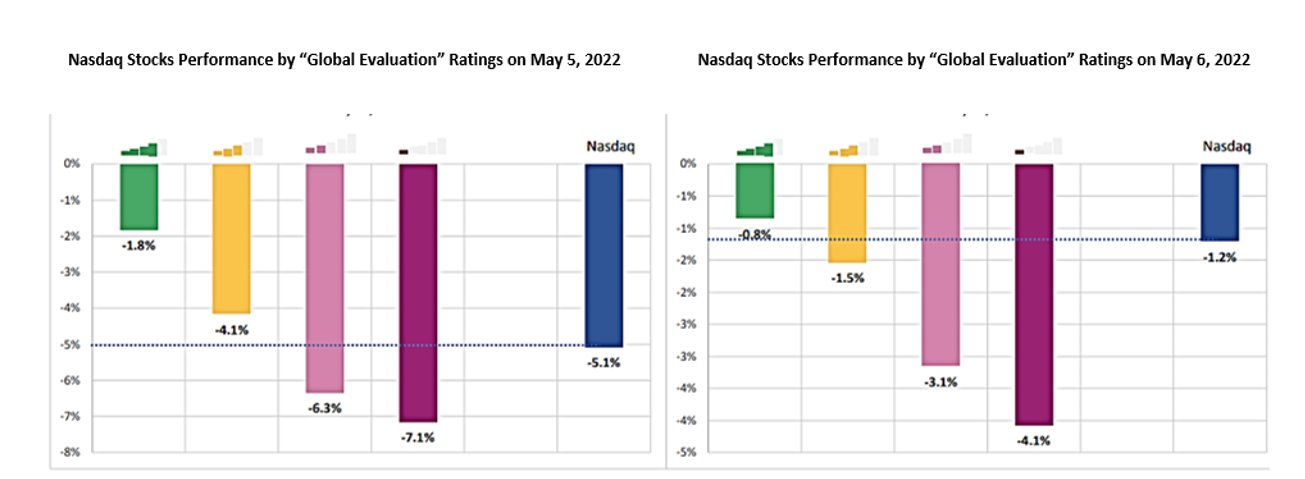
On May 4, 2022, 13 NASDAQ stocks were rated “Slightly Positive”, 40 “Neutral”, 34 “Slightly Negative” and 12 “Negative”. No component was rated “Positive”. Shown above is the average performance of the components with the corresponding rating by May 5, and May 6, respectively.
How Do We Evaluate Stocks
Global Evaluation Rating
Designed to give a broad overview of an investment at a particular point in time, Aurora’s Global Evaluation Rating combines multiple factors. These include fundamental and technical elements such as Valuation, Earnings Revisions Trend, Technical Trends, and Group Benchmarking, along with sensitivity (Risk) ratings based on the “Bear Markets” and “Bad News” Factor Metrics.
Star Rating Metric
This metric incorporates several factors including:
- Earning Revision Trend
- Valuation Rating
- Momentum (Medium Term Technical Trend)
- 4-week Relative Performance > 1%
We assess performance against each of these metrics and award a 0 to ![]()
![]()
![]()
![]() stars rating.
stars rating.
Sensitivity (Risk)
We determine Sensitivity by measuring the “Bear Market” Factor and the “Bad News” Factor against the benchmark and identify three levels:
Low Sensitivity: In this case, the sensitivity indicators fall below the world reference average.
Moderate Sensitivity: In this case, the sensitivity indicators are higher than the world reference average but lower than the standard deviation.
High Sensitivity: At which the sensitivity indicators are at levels higher than the standard deviation.
Bear Market Factor
To determine the Bear Market Factor we analyze the relationship between a stock’s price movements and declining markets, hence the name, Bear Market Factor.
The Bear Market Factor expresses in basis points the average difference over 52 weeks between the moves of the stock price and the moves of the reference index only during declines of the reference index.
The higher the Bear Market Factor, the more stock has dropped when its relative index dropped. A Bear Market Factor that is strongly negative means the stock has been more resistant to losses in declining markets.
Bad News Factor
To determine the Bad News Factor, we analyze a stock’s declines in rising markets. In this purely objective analysis, the actual reasons for a stock’s behavior are not important since if a stock price falls while its relative index goes up, it can be assumed that the stock’s performance has been affected by bad news – hence the name, Bad News Factor.
The Bad News Factor shows the average deviation per bad news event between the stock and its reference index over the previous 52 weeks and is expressed in basis points. In general terms, the higher the Bad News Factor, the more stock has been sensitive to bad news.
Conclusion
Aurora helps you to reduce your investment risk by analysis and rating the sensitivity risk of each stock, fund, and portfolio.
Disclaimer
The system provides financial information and data to help you identify investment ideas. However, we do not advise you or guide you about this or what products to purchase or sell – these decisions are yours only. SDIS and the system are not subject to regulation, and SDIS does not hold a license for investment advisory, investment marketing, or investment portfolio management under any law. The content provided on the system is independent and not based or tailored to your circumstances, To your needs, or your purposes, and should not be relied on as an estimate of profitability or the suitability of an investment in a particular stock for any purpose. Past performance is not a guarantee of present or future performance. Investments may lose their full value.