The Metrics that Matter
Here we outline the various high-level metrics which are incorporated into Aurora’s Systematic analysis, along with a breakdown of the various data points and the metrics which inform them.
Global Evaluation Metric
Designed to give a broad overview of an investment at a particular point in time, Aurora’s Global Evaluation Metric combines multiple factors which we outline in more detail below. These include fundamental and technical elements such as Valuation, Earnings Revisions Trend, Technical Trends and Group Benchmarking, along with sensitivity (Risk) ratings based on the “Bear Markets” and “Bad News” Factor Metrics. These factors are then visualised as a simple volume bar where ![]() indicates the best possible rating and
indicates the best possible rating and ![]() indicates the worst.
indicates the worst.
Star Rating Metric
This metric incorporates several factors (each of which is outlined in more detail below) and includes:
- Earning Revision Trend
- Valuation Rating
- Medium Term Technical Trend and (Market Trend)
- 4-week Relative Performance > 1%
We assess performance against each of these metrics and award a 0 to ![]()
![]()
![]()
![]() rating.
rating.
Earning Revision Trend (Earnings Rev Trend)
This is an abbreviation for 7 week Earnings Per Share Revision. This column concerns the value of these revised earnings. A figure of 2.8 implies that the analysts, compared with seven weeks ago, have now revised and raised their estimates by 2.8%. On the contrary, a negative number means that the earnings were revised at a lower estimate.
If the earnings revision is between -1% and 1% the analysts estimates are neutral.
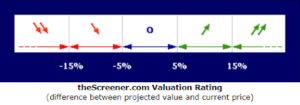
Price Valuation Rating
We use Peter Lynch’s valuation methodology to assess whether a stock is trading at fair value, premium (over-valued) or discount (under-valued). This method compares expected earnings increase + dividend yield with estimated multiplier ratio.
Based on this approach a ratio below 0.9 indicates that investors must pay a premium for the growth potential since the stock is more highly valued and if the ratio is above 0.9, the stock is undervalued.
“Since Lynch was always looking for strong growth companies he could not use the traditional Price Earnings ratios as means for valuation because the markets would often bid those stocks up on expectations. So he created a metric called PEG which stood for Price Earnings Growth. The idea was that if a company was growing at 15% per annum then 15 P/E was a reasonable price to pay for the stock. It’s a simple shortcut that ignores many macro fundamentals but that was precisely the point. It was used as a rough measure to make sure that the investor did not grossly overpay for a stock ( for example buying a stock at 50 P/E for a company that was growing at only a 10% rate).” – Boris Schlossberg, BK Asset Management
Information Ratio (for fund analysis)
The information ratio (IR) measures portfolio returns against the returns of a benchmark, usually an index, related to the volatility of those returns. The benchmark used is often an index that represents the market or a particular sector or industry. IR is often used as a measure of a portfolio manager’s level of skill and their ability to generate excess returns relative to a benchmark, but it also attempts to identify the consistency of the performance by incorporating a tracking error, or standard deviation component into the calculation.
.
Further Information
SharpE Ratio (for fund analysis)
Developed by Nobel laureate William F. Sharpe, the Sharpe Ratio is one of the most well-known investment metrics and and is used to help investors understand the return of an investment compared to its risk.
You can read more about how the Sharpe Ration is calculated here, but for our purposes the most important thing to know is that the higher the ratio, the better and that generally speaking, anything below one should be considered suboptimal and too risky.
Medium Term Technical Trend (MT Tech Trend)
MT Tech Trend is a technical indicator which we use to provide an assessment of whether the market like an investment or dislike it. If it is positive it indicates that the market currently “likes” (or, is buying) the stock. If it is negative it indicates that the market currently “does not like” (or, is selling) the stock.
4-Week Relative Performance (4wk Rel Perf)
This figure measures the performance of a STOCK relative to its national or regional index in the last 4 weeks).
6-MONTH RELATIVE Performance (6M Rel Perf)
This figure measures the performance of a FUND relative to its benchmark in the last six month.
Long Term Growth Forecast (LT Growth)
This is the estimated annual growth rate of future earnings. It is normally projected over the next two to three years, and is expressed as a percentage.
Growth / Price-Earnings Ratio (G/PE Ratio)
The G/PE Ratio is the basis of our Valuation Rating (above) and is expressed as the estimated growth of future earnings (LT Growth) plus dividend in %, divided by the estimated future PE ratio (Long Term P/E).
Bad News Factor
To determine the Bad News Factor, we analyse a stock’s declines in rising markets. In this purely objective analysis, the actual reasons for a stock’s behaviour are not important since if a stock price falls while its relative index goes up, it can be assumed that the stock’s performance has been affected by bad news – hence the name, Bad News Factor.
The Bad News Factor shows the average deviation per bad news event between the stock and its reference index over the previous 52 weeks and is expressed in basis points. In general terms, the higher the Bad News Factor, the more a stock has been sensitive to bad news.
Bear Market Factor
To determine the Bear Market Factor we analyse the relationship between a stock’s price movements and declining markets, hence the name, Bear Market Factor.
The Bear Market Factor expresses in basis points the average difference over 52 weeks between the moves of the stock price and the moves of the reference index only during declines of the reference index.
The higher the Bear Market Factor, the more a stock has dropped when its relative index dropped. A Bear Market Factor that is strongly negative means the stock has been more resistant to losses in declining markets.
Sensitivity (rISK)
Stock price movements are generally volatile and contain sensitivity that can result in a total loss. Based on their historical behaviour, we classify stocks by sensitivity level which are assessed solely relative to other stocks.
It should be noted that even Low Sensitivity stocks remain highly sensitive investments that can lose up to all of their value, and that past performance is no indication of current or future performance.
We determine Sensitivity by measuring the “Bear Market” Factor and the “Bad News” Factor against the benchmark and identify three levels:
Low Sensitivity: In this case, the sensitivity indicators fall below the world reference average.
Moderate Sensitivity: In this case, the sensitivity indicators are higher than the world reference average, but lower than the standard deviation.
High Sensitivity: At which the sensitivity indicators are at levels higher than the standard deviation.